

Question: SFO and Quantum Secures SAFE System Case Synopsis: In 2008 San Francisco International Airport (known by its three-letter airport code, SFO) had announced a $383
SFO and Quantum Secures SAFE System Case Synopsis: In 2008 San Francisco International Airport (known by its three-letter airport code, SFO) had announced a $383 million plan to renovate and reopen Terminal 2. Assistant deputy director of aviation security Kim Dickie and her team had selected Quantum Secures SAFE software suite as the new Terminal 2 credentialing system, but she needed to develop a business case that would convince senior management to give the green light to fund the purchase. Instructions: The discussion and analysis must be centered on determining factors that drive the internal rate of return (IRR), net present value (NPV), and payback period. Please use the provided spreadsheet for calculating these three values. Deliverables (due Sunday, no later than 11:59pm): 1. The completed spreadsheet 2. A short report summarizing key challenges SFO is facing, and a recommendation concerning whether or not to proceed with the proposed project by citing IRR, NPV, and payback period.
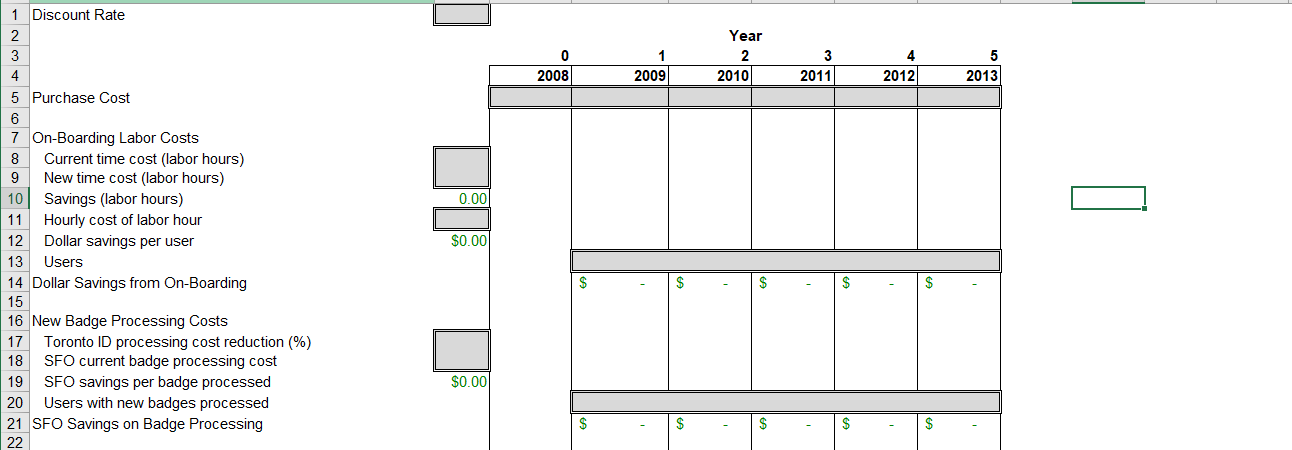
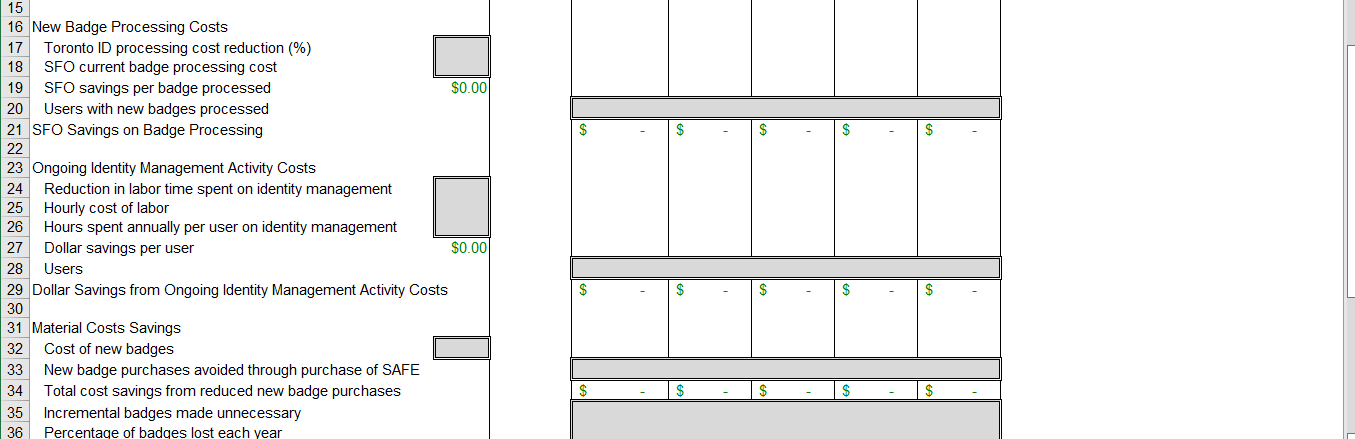
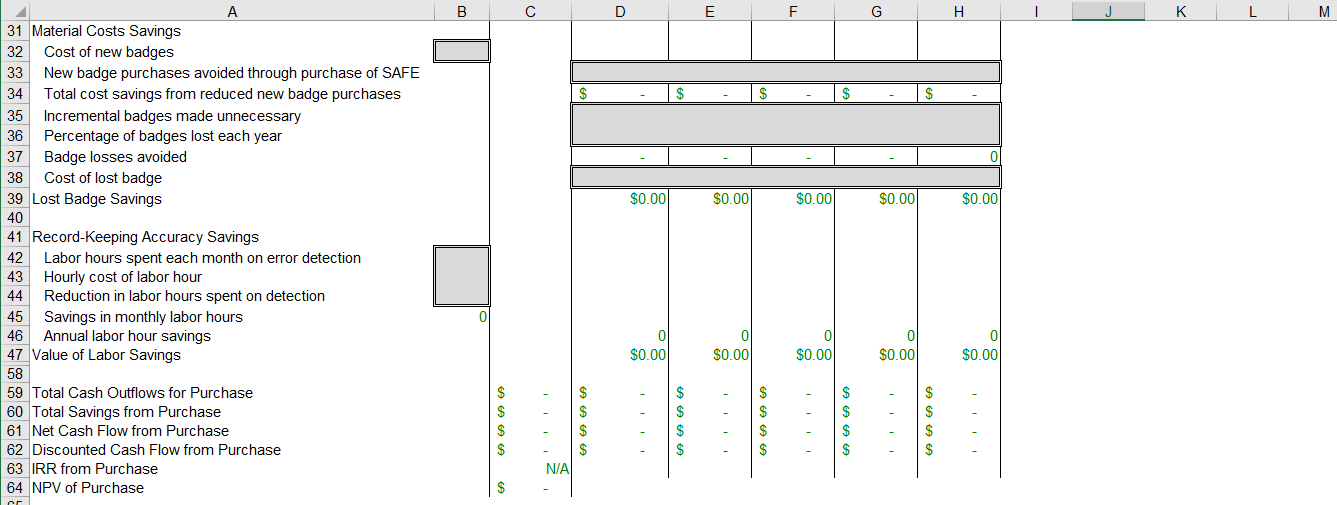
MIS 7671 Case Discussion SFO and Quantum Secure's SAFE System Case Synopsis: In 2008 San Francisco International Airport (known by its three-letter airport code, SFO) had announced a $383 million plan to renovate and reopen Terminal 2. Assistant deputy director of aviation security Kim Dickie and her team had selected Quantum Secure's SAFE software suite as the new Terminal 2 credentialing system, but she needed to develop a business case that would convince senior management to give the green light to fund the purchase. Instructions: The discussion and analysis must be centered on determining factors that drive the internal rate of return (IRR), net present value (NPV), and payback period. Please use the provided spreadsheet for calculating these three values. Deliverables (due Sunday, no later than 11:59pm): 1. The completed spreadsheet 2. A short report summarizing key challenges SFO is facing, and a recommendation concerning whether or not to proceed with the proposed project by citing IRR, NPV, and payback period. 1 Discount Rate 2 3 0 2008 4 Year 2 2010 1 2009 3 2011 5 2013 4 2012 0.00 $0.00 5 Purchase Cost 6 7 On-Boarding Labor Costs 8 Current time cost (labor hours) 9 New time cost (labor hours) 10 Savings (labor hours) 11 Hourly cost of labor hour 12 Dollar savings per user 13 Users 14 Dollar Savings from On-Boarding 15 16 New Badge Processing Costs 17 Toronto ID processing cost reduction (%) 18 SFO current badge processing cost 19 SFO savings per badge processed 20 Users with new badges processed 21 SFO Savings on Badge Processing 22 $ $ $ $ $ $0.00 $ $ $ $ $ 15 16 New Badge Processing Costs 17 Toronto ID processing cost reduction (%) 18 SFO current badge processing cost 19 SFO savings per badge processed $0.00 20 Users with new badges processed 21 SFO Savings on Badge Processing 22 23 Ongoing Identity Management Activity Costs 24 Reduction in labor time spent on identity management 25 Hourly cost of labor 26 Hours spent annually per user on identity management 27 Dollar savings per user $0.00 28 Users 29 Dollar Savings from Ongoing Identity Management Activity Costs 30 31 Material Costs Savings 32 Cost of new badges 33 New badge purchases avoided through purchase of SAFE 34 Total cost savings from reduced new badge purchases 35 Incremental badges made unnecessary 36 Percentage of badges lost each year $ $ $ B 0 E F G H K M $ $0.00 $0.00 $0.00 $0.00 $0.00 A 31 Material Costs Savings 32 Cost of new badges 33 New badge purchases avoided through purchase of SAFE 34 Total cost savings from reduced new badge purchases 35 Incremental badges made unnecessary 36 Percentage of badges lost each year 37 Badge losses avoided 38 Cost of lost badge 39 Lost Badge Savings 40 41 Record-keeping Accuracy Savings 42 Labor hours spent each month on error detection 43 Hourly cost of labor hour 44 Reduction in labor hours spent on detection 45 Savings in monthly labor hours 46 Annual labor hour savings 47 Value of Labor Savings 58 59 Total Cash Outflows for Purchase 60 Total Savings from Purchase 61 Net Cash Flow from Purchase 62 Discounted Cash Flow from Purchase 63 IRR from Purchase 64 NPV of Purchase ce 0 0 $0.00 0 $0.00 $0.00 $0.00 $0.00 $ $ $ $ $ $ $ $ $ . N/A $ MIS 7671 Case Discussion SFO and Quantum Secure's SAFE System Case Synopsis: In 2008 San Francisco International Airport (known by its three-letter airport code, SFO) had announced a $383 million plan to renovate and reopen Terminal 2. Assistant deputy director of aviation security Kim Dickie and her team had selected Quantum Secure's SAFE software suite as the new Terminal 2 credentialing system, but she needed to develop a business case that would convince senior management to give the green light to fund the purchase. Instructions: The discussion and analysis must be centered on determining factors that drive the internal rate of return (IRR), net present value (NPV), and payback period. Please use the provided spreadsheet for calculating these three values. Deliverables (due Sunday, no later than 11:59pm): 1. The completed spreadsheet 2. A short report summarizing key challenges SFO is facing, and a recommendation concerning whether or not to proceed with the proposed project by citing IRR, NPV, and payback period. 1 Discount Rate 2 3 0 2008 4 Year 2 2010 1 2009 3 2011 5 2013 4 2012 0.00 $0.00 5 Purchase Cost 6 7 On-Boarding Labor Costs 8 Current time cost (labor hours) 9 New time cost (labor hours) 10 Savings (labor hours) 11 Hourly cost of labor hour 12 Dollar savings per user 13 Users 14 Dollar Savings from On-Boarding 15 16 New Badge Processing Costs 17 Toronto ID processing cost reduction (%) 18 SFO current badge processing cost 19 SFO savings per badge processed 20 Users with new badges processed 21 SFO Savings on Badge Processing 22 $ $ $ $ $ $0.00 $ $ $ $ $ 15 16 New Badge Processing Costs 17 Toronto ID processing cost reduction (%) 18 SFO current badge processing cost 19 SFO savings per badge processed $0.00 20 Users with new badges processed 21 SFO Savings on Badge Processing 22 23 Ongoing Identity Management Activity Costs 24 Reduction in labor time spent on identity management 25 Hourly cost of labor 26 Hours spent annually per user on identity management 27 Dollar savings per user $0.00 28 Users 29 Dollar Savings from Ongoing Identity Management Activity Costs 30 31 Material Costs Savings 32 Cost of new badges 33 New badge purchases avoided through purchase of SAFE 34 Total cost savings from reduced new badge purchases 35 Incremental badges made unnecessary 36 Percentage of badges lost each year $ $ $ B 0 E F G H K M $ $0.00 $0.00 $0.00 $0.00 $0.00 A 31 Material Costs Savings 32 Cost of new badges 33 New badge purchases avoided through purchase of SAFE 34 Total cost savings from reduced new badge purchases 35 Incremental badges made unnecessary 36 Percentage of badges lost each year 37 Badge losses avoided 38 Cost of lost badge 39 Lost Badge Savings 40 41 Record-keeping Accuracy Savings 42 Labor hours spent each month on error detection 43 Hourly cost of labor hour 44 Reduction in labor hours spent on detection 45 Savings in monthly labor hours 46 Annual labor hour savings 47 Value of Labor Savings 58 59 Total Cash Outflows for Purchase 60 Total Savings from Purchase 61 Net Cash Flow from Purchase 62 Discounted Cash Flow from Purchase 63 IRR from Purchase 64 NPV of Purchase ce 0 0 $0.00 0 $0.00 $0.00 $0.00 $0.00 $ $ $ $ $ $ $ $ $ . N/A $
Step by Step Solution
There are 3 Steps involved in it

Get step-by-step solutions from verified subject matter experts