

Question: Shape: part. PART III: Max = = $0 = 20 = TO Min = BODY TEMPERATURES OOL 866 966 2 66 66 986 + 86
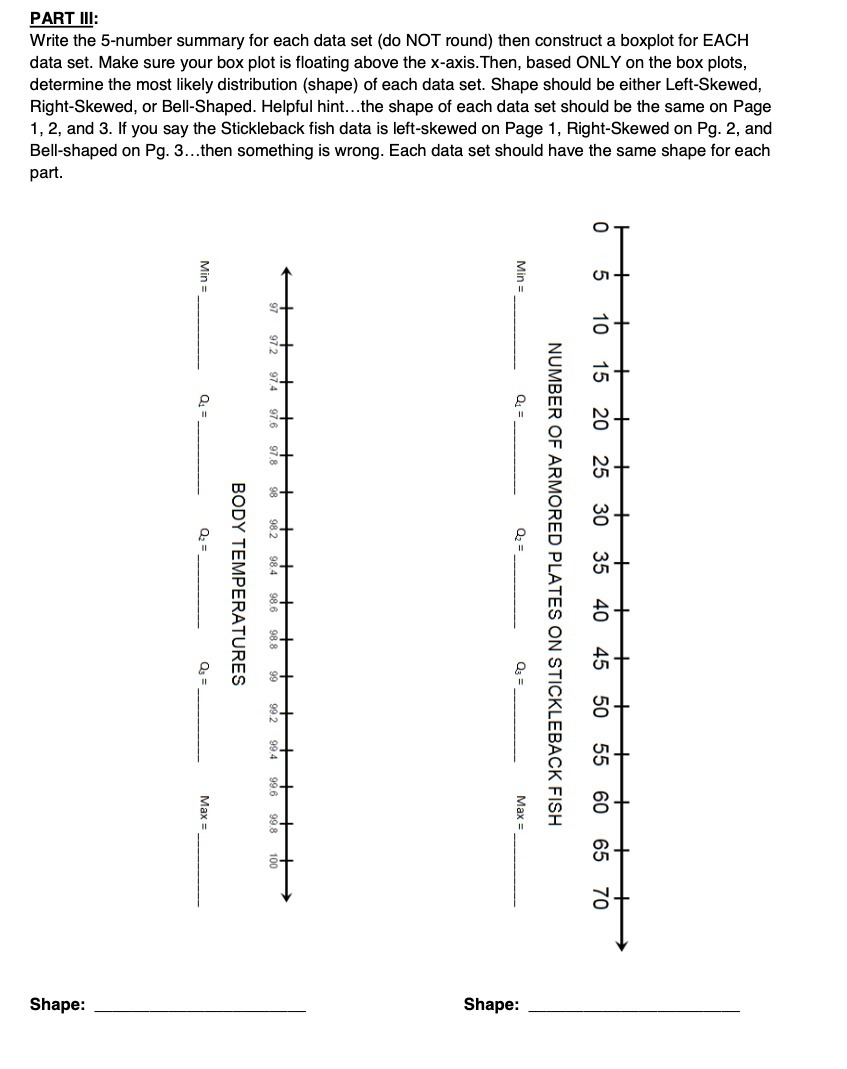
Shape: part. PART III: Max = = $0 = 20 = TO Min = BODY TEMPERATURES OOL 866 966 2 66 66 986 + 86 286 86 826 926 26 2 26 Shape: Max = = 0 =20 = TO Min = NUMBER OF ARMORED PLATES ON STICKLEBACK FISH 10 15 20 25 30 35 40 45 50 55 60 65 70 Bell-shaped on Pg. 3...then something is wrong. Each data set should have the same shape for each 1, 2, and 3. If you say the Stickleback fish data is left-skewed on Page 1, Right-Skewed on Pg. 2, and Right-Skewed, or Bell-Shaped. Helpful hint...the shape of each data set should be the same on Page determine the most likely distribution (shape) of each data set. Shape should be either Left-Skewed, data set. Make sure your box plot is floating above the x-axis. Then, based ONLY on the box plots, Write the 5-number summary for each data set (do NOT round) then construct a boxplot for EACH
Step by Step Solution
There are 3 Steps involved in it

Get step-by-step solutions from verified subject matter experts