Question: Shape Suppose that we had 200 college students draw samples with the paddle that had 40 beads (representing the fingerprints of 40 individuals) and 100
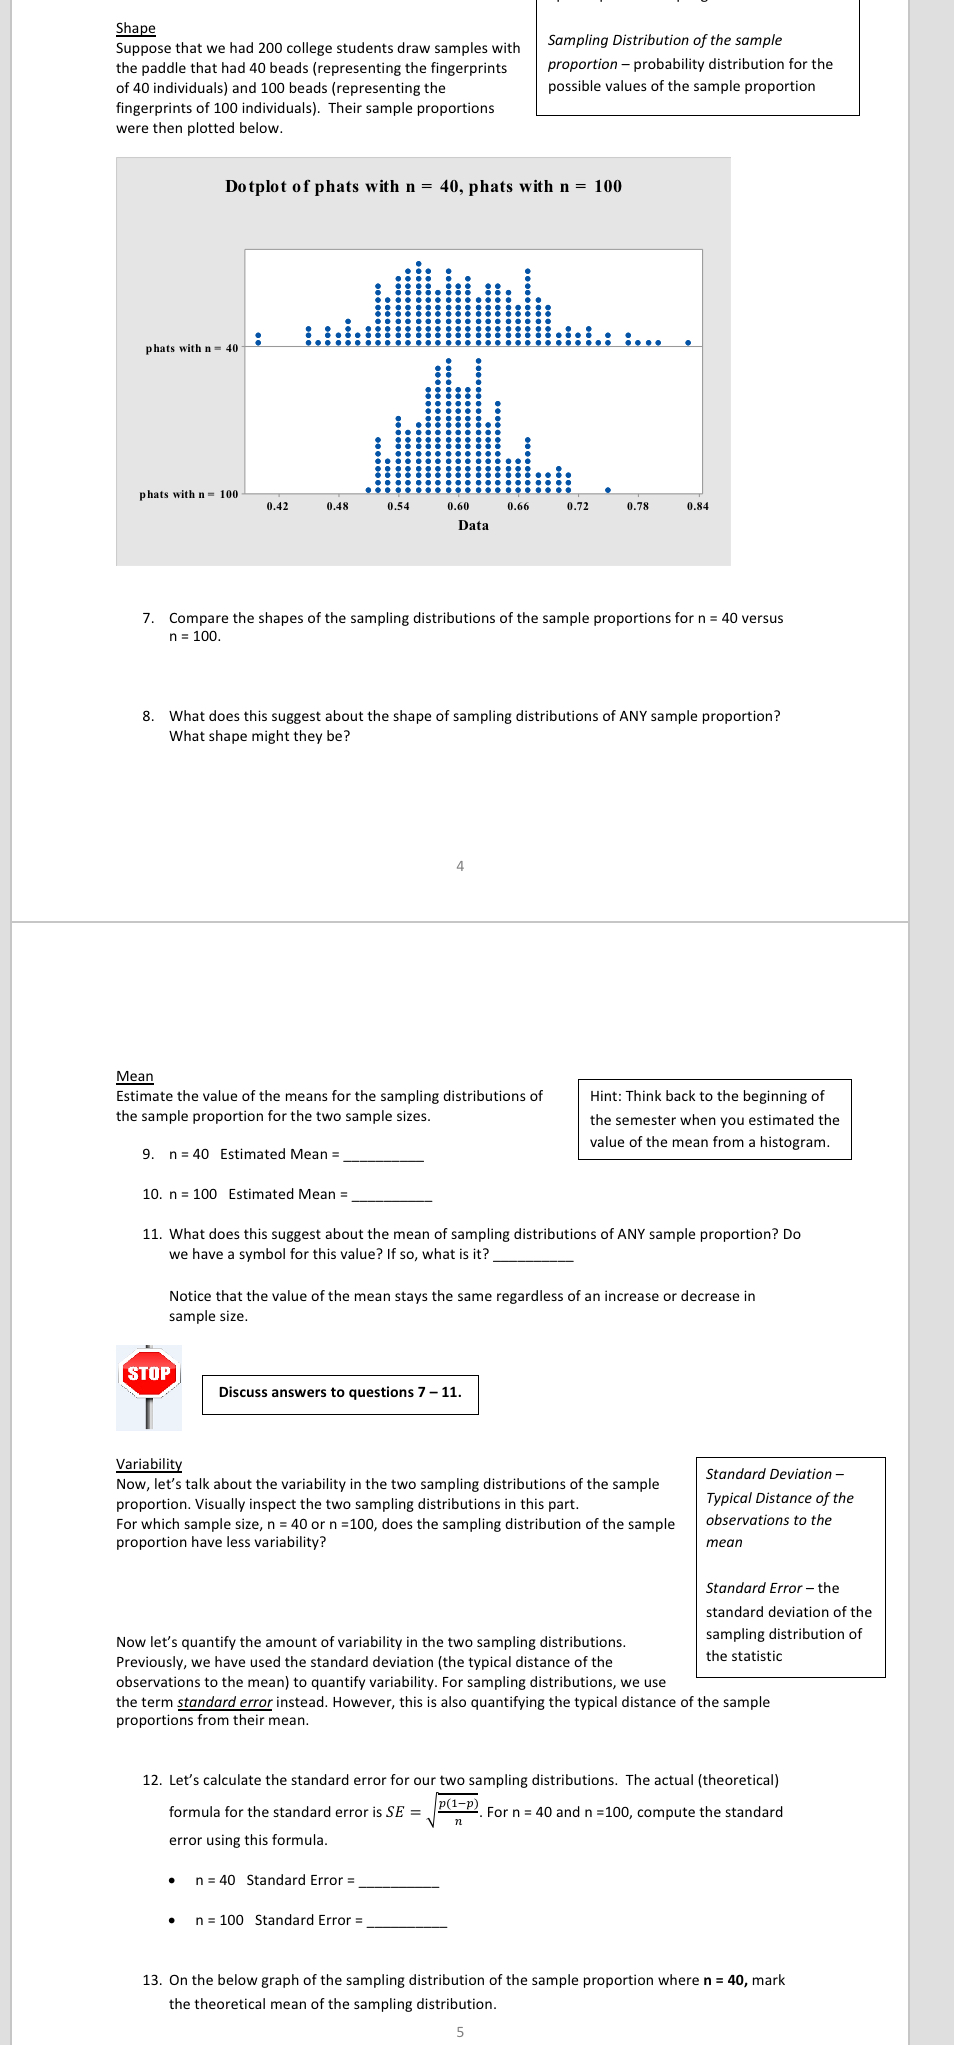
Shape Suppose that we had 200 college students draw samples with the paddle that had 40 beads (representing the fingerprints of 40 individuals) and 100 beads (representing the fingerprints of 100 individuals). Their sample proportions were then plotted below. Sampling Distribution of the sample proportion - probability distribution for the possible values of the sample proportion Dotplot of phats with n = 40, phats with n = 100 : phats with n = 40 phats with n - 100 0.42 0.48 0.54 0.60 0.66 0.72 0.78 0.84 Data 7. Compare the shapes of the sampling distributions of the sample proportions for n = 40 versus n = 100. 8. What does this suggest about the shape of sampling distributions of ANY sample proportion? What shape might they be? 4 Mean Estimate the value of the means for the sampling distributions of the sample proportion for the two sample sizes. Hint: Think back to the beginning of the semester when you estimated the value of the mean from a histogram. 9. n = 40 Estimated Mean = 10. n = 100 Estimated Mean = 11. What does this suggest about the mean of sampling distributions of ANY sample proportion? Do we have a symbol for this value? If so, what is it? Notice that the value of the mean stays the same regardless of an increase or decrease in sample size. STOP Discuss answers to questions 7-11. Variability Now, let's talk about the variability in the two sampling distributions of the sample proportion. Visually inspect the two sampling distributions in this part. For which sample size, n = 40 or n =100, does the sampling distribution of the sample proportion have less variability? Standard Deviation - Typical Distance of the observations to the mean Standard Error - the standard deviation of the Now let's quantify the amount of variability in the two sampling distributions. sampling distribution of Previously, we have used the standard deviation (the typical distance of the the statistic observations to the mean) to quantify variability. For sampling distributions, we use the term standard error instead. However, this is also quantifying the typical distance of the sample proportions from their mean. 12. Let's calculate the standard error for our two sampling distributions. The actual (theoretical) formula for the standard error is SE = p(1-P) For n = 40 and n = 100, compute the standard error using this formula. n n = 40 Standard Error = n = 100 Standard Error = 13. On the below graph of the sampling distribution of the sample proportion where n = 40, mark the theoretical mean of the sampling distribution. Shape Suppose that we had 200 college students draw samples with the paddle that had 40 beads (representing the fingerprints of 40 individuals) and 100 beads (representing the fingerprints of 100 individuals). Their sample proportions were then plotted below. Sampling Distribution of the sample proportion - probability distribution for the possible values of the sample proportion Dotplot of phats with n = 40, phats with n = 100 : phats with n = 40 phats with n - 100 0.42 0.48 0.54 0.60 0.66 0.72 0.78 0.84 Data 7. Compare the shapes of the sampling distributions of the sample proportions for n = 40 versus n = 100. 8. What does this suggest about the shape of sampling distributions of ANY sample proportion? What shape might they be? 4 Mean Estimate the value of the means for the sampling distributions of the sample proportion for the two sample sizes. Hint: Think back to the beginning of the semester when you estimated the value of the mean from a histogram. 9. n = 40 Estimated Mean = 10. n = 100 Estimated Mean = 11. What does this suggest about the mean of sampling distributions of ANY sample proportion? Do we have a symbol for this value? If so, what is it? Notice that the value of the mean stays the same regardless of an increase or decrease in sample size. STOP Discuss answers to questions 7-11. Variability Now, let's talk about the variability in the two sampling distributions of the sample proportion. Visually inspect the two sampling distributions in this part. For which sample size, n = 40 or n =100, does the sampling distribution of the sample proportion have less variability? Standard Deviation - Typical Distance of the observations to the mean Standard Error - the standard deviation of the Now let's quantify the amount of variability in the two sampling distributions. sampling distribution of Previously, we have used the standard deviation (the typical distance of the the statistic observations to the mean) to quantify variability. For sampling distributions, we use the term standard error instead. However, this is also quantifying the typical distance of the sample proportions from their mean. 12. Let's calculate the standard error for our two sampling distributions. The actual (theoretical) formula for the standard error is SE = p(1-P) For n = 40 and n = 100, compute the standard error using this formula. n n = 40 Standard Error = n = 100 Standard Error = 13. On the below graph of the sampling distribution of the sample proportion where n = 40, mark the theoretical mean of the sampling distribution


