

Question: . Sheet1 Sheet2 Sheet3 + A v11 The general setup for the two-way analysis of variance table is shown in Table 15.9. For the fuelconsumption
.
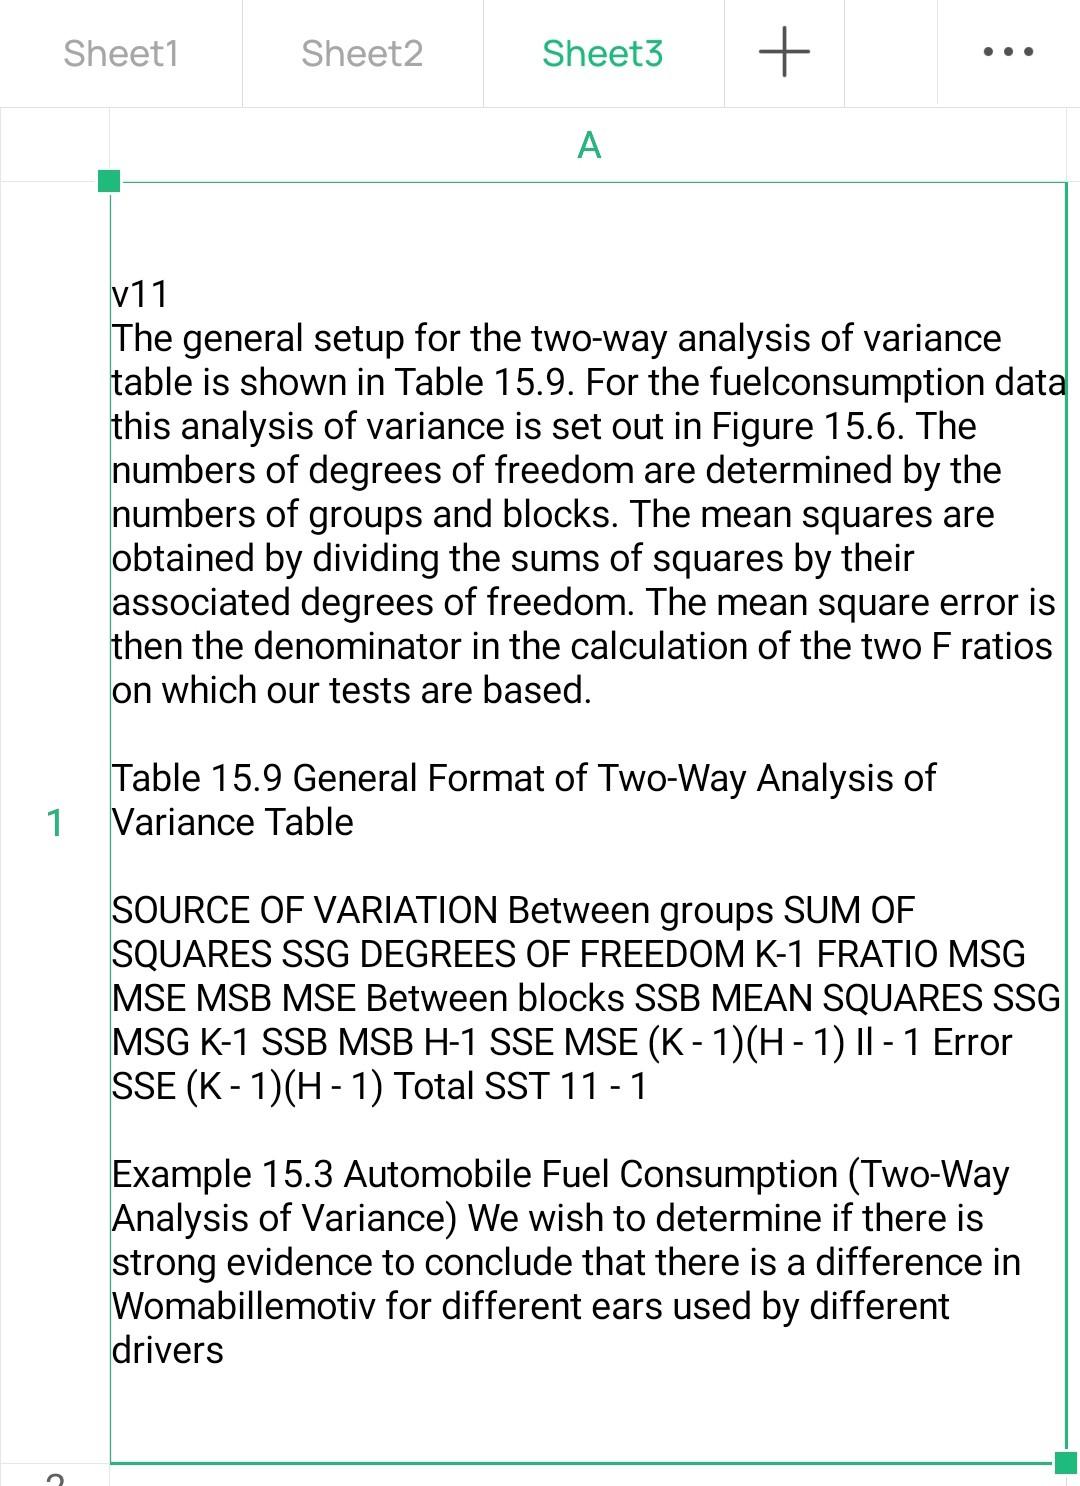
Sheet1 Sheet2 Sheet3 + A v11 The general setup for the two-way analysis of variance table is shown in Table 15.9. For the fuelconsumption data this analysis of variance is set out in Figure 15.6. The numbers of degrees of freedom are determined by the numbers of groups and blocks. The mean squares are obtained by dividing the sums of squares by their associated degrees of freedom. The mean square error is then the denominator in the calculation of the two F ratios on which our tests are based. Table 15.9 General Format of Two-Way Analysis of Variance Table 1 SOURCE OF VARIATION Between groups SUM OF SQUARES SSG DEGREES OF FREEDOM K-1 FRATIO MSG MSE MSB MSE Between blocks SSB MEAN SQUARES SSG MSG K-1 SSB MSB H-1 SSE MSE (K-1)(H - 1) 11 - 1 Error SSE (K-1)(H-1) Total SST 11 - 1 Example 15.3 Automobile Fuel Consumption (Two-Way Analysis of Variance) We wish to determine if there is strong evidence to conclude that there is a difference in Womabillemotiv for different ears used by different driversStep by Step Solution
There are 3 Steps involved in it
1 Expert Approved Answer
Step: 1 Unlock

Question Has Been Solved by an Expert!
Get step-by-step solutions from verified subject matter experts
Step: 2 Unlock
Step: 3 Unlock