Question: Sheet1 Sheet2 Sheet3 Industry Alberta Ist Pr in Time % Change % Change Shift - Overall Growth Transportation & Warehousing Construction Total Employment 115.800 234.900
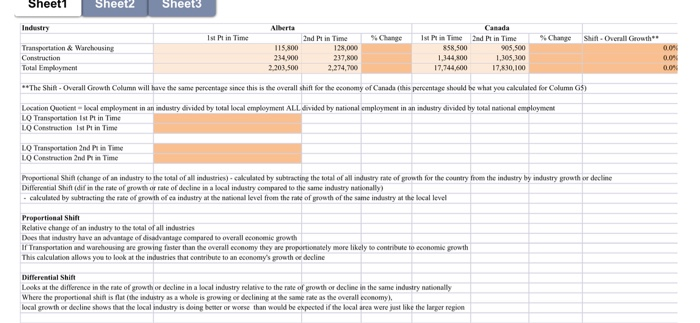
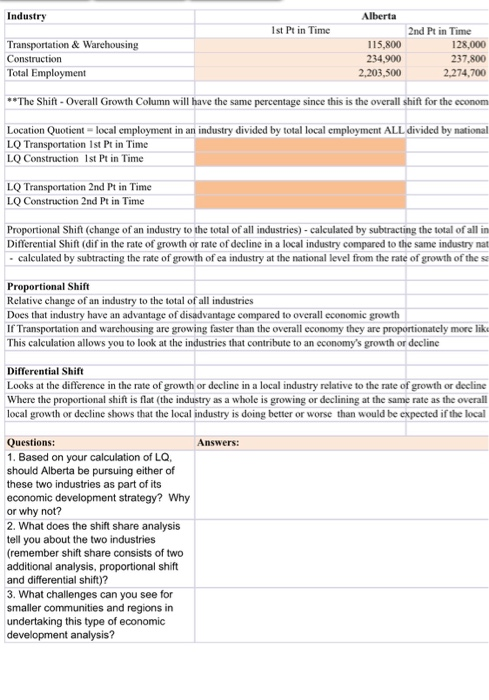
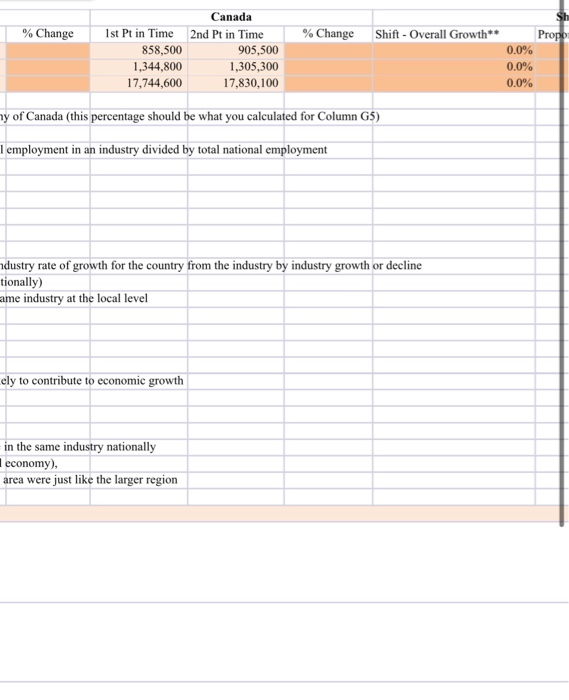
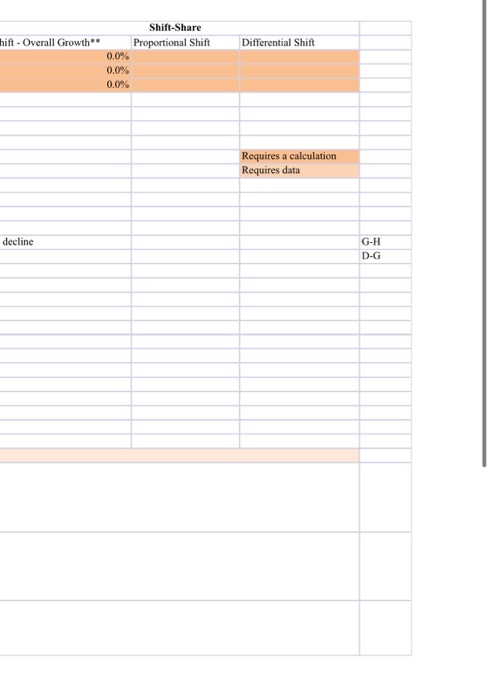
Sheet1 Sheet2 Sheet3 Industry Alberta Ist Pr in Time % Change % Change Shift - Overall Growth Transportation & Warehousing Construction Total Employment 115.800 234.900 2,203,500 2nd Pt in Time 128,000 237,800 2,274,700 Canada Ist Plin Time 2nd Prin Time 858,500 1,344,300 1,305,300 17.744,600 17.830,100 0.0% 0.0 0.0% **The Shift - Overall Growth Column will have the same percentage since this is the overall shift for the economy of Canada (this percentage should be what you calculated for Column GS) Location Quotient local employment in an industry divided by total local employment ALL. divided by national employment in an industry divided by total national employment LO Transportation ist in Time LO Construction Ist Pin Time LO Transportation and in Time LO Construction 2nd Pl in Time Proportional Shift (change of an industry to the total of all industries) - calculated by subtracting the total of all industry rate of growth for the country from the industry by industry growth or decline Differential Shift (dif in the rate of growth or rate of decline in a local industry compared to the same industry nationally) - calculated by subtracting the rate of growth of ea industry at the national level from the rate of growth of the same industry at the local level Proportional Shift Relative change of an industry to the wel of all industries Does that industry have an advantage of disadvantage compared to overall economic growth of Transportation and warehousing are growing faster than the overall economy they are proportionately more likely to contribute to economic growth This calculation allows you to look at the industries that contribute to an economy's growth decline Differential Shine Looks at the difference in the rate of growth or decline in a local industry relative to the rate of growth or decline in the same industry nationally Where the proportional shift is flat (the industry as a whole is growing or declining at the same rate as the overall conomy). local growth or decline shows that the local industry is doing better or worse than would be expected if the local area were just like the larger region Answers: Questions: 1. Based on your calculation of LQ, should Alberta be pursuing either of these two industries as part of its economic development strategy? Why or why not? 2. What does the shift share analysis tell you about the two industries (remember shift share consists of two additional analysis, proportional shift and differential shift)? 3. What challenges can you see for smaller communities and regions in undertaking this type of economic development analysis? Industry Alberta 1st Pt in Time Transportation & Warehousing Construction Total Employment 115,800 234,900 2,203,500 2nd Pt in Time 128,000 237,800 2,274,700 **The Shift - Overall Growth Column will have the same percentage since this is the overall shift for the econom Location Quotient - local employment in an industry divided by total local employment ALL divided by national LQ Transportation 1st Pt in Time LQ Construction Ist Pt in Time LQ Transportation 2nd Pt in Time LQ Construction 2nd Pt in Time Proportional Shift (change of an industry to the total of all industries) - calculated by subtracting the total of all in Differential Shift (dif in the rate of growth or rate of decline in a local industry compared to the same industry nat - calculated by subtracting the rate of growth of ea industry at the national level from the rate of growth of the s Proportional Shift Relative change of an industry to the total of all industries Does that industry have an advantage of disadvantage compared to overall economic growth If Transportation and warehousing are growing faster than the overall economy they are proportionately more like This calculation allows you to look at the industries that contribute to an economy's growth or decline Differential Shift Looks at the difference in the rate of growth or decline in a local industry relative to the rate of growth or decline Where the proportional shift is flat (the industry as a whole is growing or declining at the same rate as the overall local growth or decline shows that the local industry is doing better or worse than would be expected if the local Answers: Questions: 1. Based on your calculation of LQ. should Alberta be pursuing either of these two industries as part of its economic development strategy? Why or why not? 2. What does the shift share analysis tell you about the two industries (remember shift share consists of two additional analysis, proportional shift and differential shift)? 3. What challenges can you see for smaller communities and regions in undertaking this type of economic development analysis ? % Change % Change Shift - Overall Growth** Propo Canada 1st Pt in Time 2nd Pt in Time 858,500 905,500 1,344,800 1,305,300 17,744,600 17,830,100 0.0% 0.0% 0.0% ny of Canada (this percentage should be what you calculated for Column G5) I employment in an industry divided by total national employment ndustry rate of growth for the country from the industry by industry growth or decline tionally) ame industry at the local level ely to contribute to economic growth in the same industry nationally economy), area were just like the larger region hift - Overall Growth** Shift-Share Proportional Shift Differential Shift 0.0% 0.0% 0.0% Requires a calculation Requires data decline G-H D-G Sheet1 Sheet2 Sheet3 Industry Alberta Ist Pr in Time % Change % Change Shift - Overall Growth Transportation & Warehousing Construction Total Employment 115.800 234.900 2,203,500 2nd Pt in Time 128,000 237,800 2,274,700 Canada Ist Plin Time 2nd Prin Time 858,500 1,344,300 1,305,300 17.744,600 17.830,100 0.0% 0.0 0.0% **The Shift - Overall Growth Column will have the same percentage since this is the overall shift for the economy of Canada (this percentage should be what you calculated for Column GS) Location Quotient local employment in an industry divided by total local employment ALL. divided by national employment in an industry divided by total national employment LO Transportation ist in Time LO Construction Ist Pin Time LO Transportation and in Time LO Construction 2nd Pl in Time Proportional Shift (change of an industry to the total of all industries) - calculated by subtracting the total of all industry rate of growth for the country from the industry by industry growth or decline Differential Shift (dif in the rate of growth or rate of decline in a local industry compared to the same industry nationally) - calculated by subtracting the rate of growth of ea industry at the national level from the rate of growth of the same industry at the local level Proportional Shift Relative change of an industry to the wel of all industries Does that industry have an advantage of disadvantage compared to overall economic growth of Transportation and warehousing are growing faster than the overall economy they are proportionately more likely to contribute to economic growth This calculation allows you to look at the industries that contribute to an economy's growth decline Differential Shine Looks at the difference in the rate of growth or decline in a local industry relative to the rate of growth or decline in the same industry nationally Where the proportional shift is flat (the industry as a whole is growing or declining at the same rate as the overall conomy). local growth or decline shows that the local industry is doing better or worse than would be expected if the local area were just like the larger region Answers: Questions: 1. Based on your calculation of LQ, should Alberta be pursuing either of these two industries as part of its economic development strategy? Why or why not? 2. What does the shift share analysis tell you about the two industries (remember shift share consists of two additional analysis, proportional shift and differential shift)? 3. What challenges can you see for smaller communities and regions in undertaking this type of economic development analysis? Industry Alberta 1st Pt in Time Transportation & Warehousing Construction Total Employment 115,800 234,900 2,203,500 2nd Pt in Time 128,000 237,800 2,274,700 **The Shift - Overall Growth Column will have the same percentage since this is the overall shift for the econom Location Quotient - local employment in an industry divided by total local employment ALL divided by national LQ Transportation 1st Pt in Time LQ Construction Ist Pt in Time LQ Transportation 2nd Pt in Time LQ Construction 2nd Pt in Time Proportional Shift (change of an industry to the total of all industries) - calculated by subtracting the total of all in Differential Shift (dif in the rate of growth or rate of decline in a local industry compared to the same industry nat - calculated by subtracting the rate of growth of ea industry at the national level from the rate of growth of the s Proportional Shift Relative change of an industry to the total of all industries Does that industry have an advantage of disadvantage compared to overall economic growth If Transportation and warehousing are growing faster than the overall economy they are proportionately more like This calculation allows you to look at the industries that contribute to an economy's growth or decline Differential Shift Looks at the difference in the rate of growth or decline in a local industry relative to the rate of growth or decline Where the proportional shift is flat (the industry as a whole is growing or declining at the same rate as the overall local growth or decline shows that the local industry is doing better or worse than would be expected if the local Answers: Questions: 1. Based on your calculation of LQ. should Alberta be pursuing either of these two industries as part of its economic development strategy? Why or why not? 2. What does the shift share analysis tell you about the two industries (remember shift share consists of two additional analysis, proportional shift and differential shift)? 3. What challenges can you see for smaller communities and regions in undertaking this type of economic development analysis ? % Change % Change Shift - Overall Growth** Propo Canada 1st Pt in Time 2nd Pt in Time 858,500 905,500 1,344,800 1,305,300 17,744,600 17,830,100 0.0% 0.0% 0.0% ny of Canada (this percentage should be what you calculated for Column G5) I employment in an industry divided by total national employment ndustry rate of growth for the country from the industry by industry growth or decline tionally) ame industry at the local level ely to contribute to economic growth in the same industry nationally economy), area were just like the larger region hift - Overall Growth** Shift-Share Proportional Shift Differential Shift 0.0% 0.0% 0.0% Requires a calculation Requires data decline G-H D-G