

Question: Short answer please Data: The below data shows federal funds rates of the United State of America. FRED. - Federal Funds Target Range - Lower
Short answer please
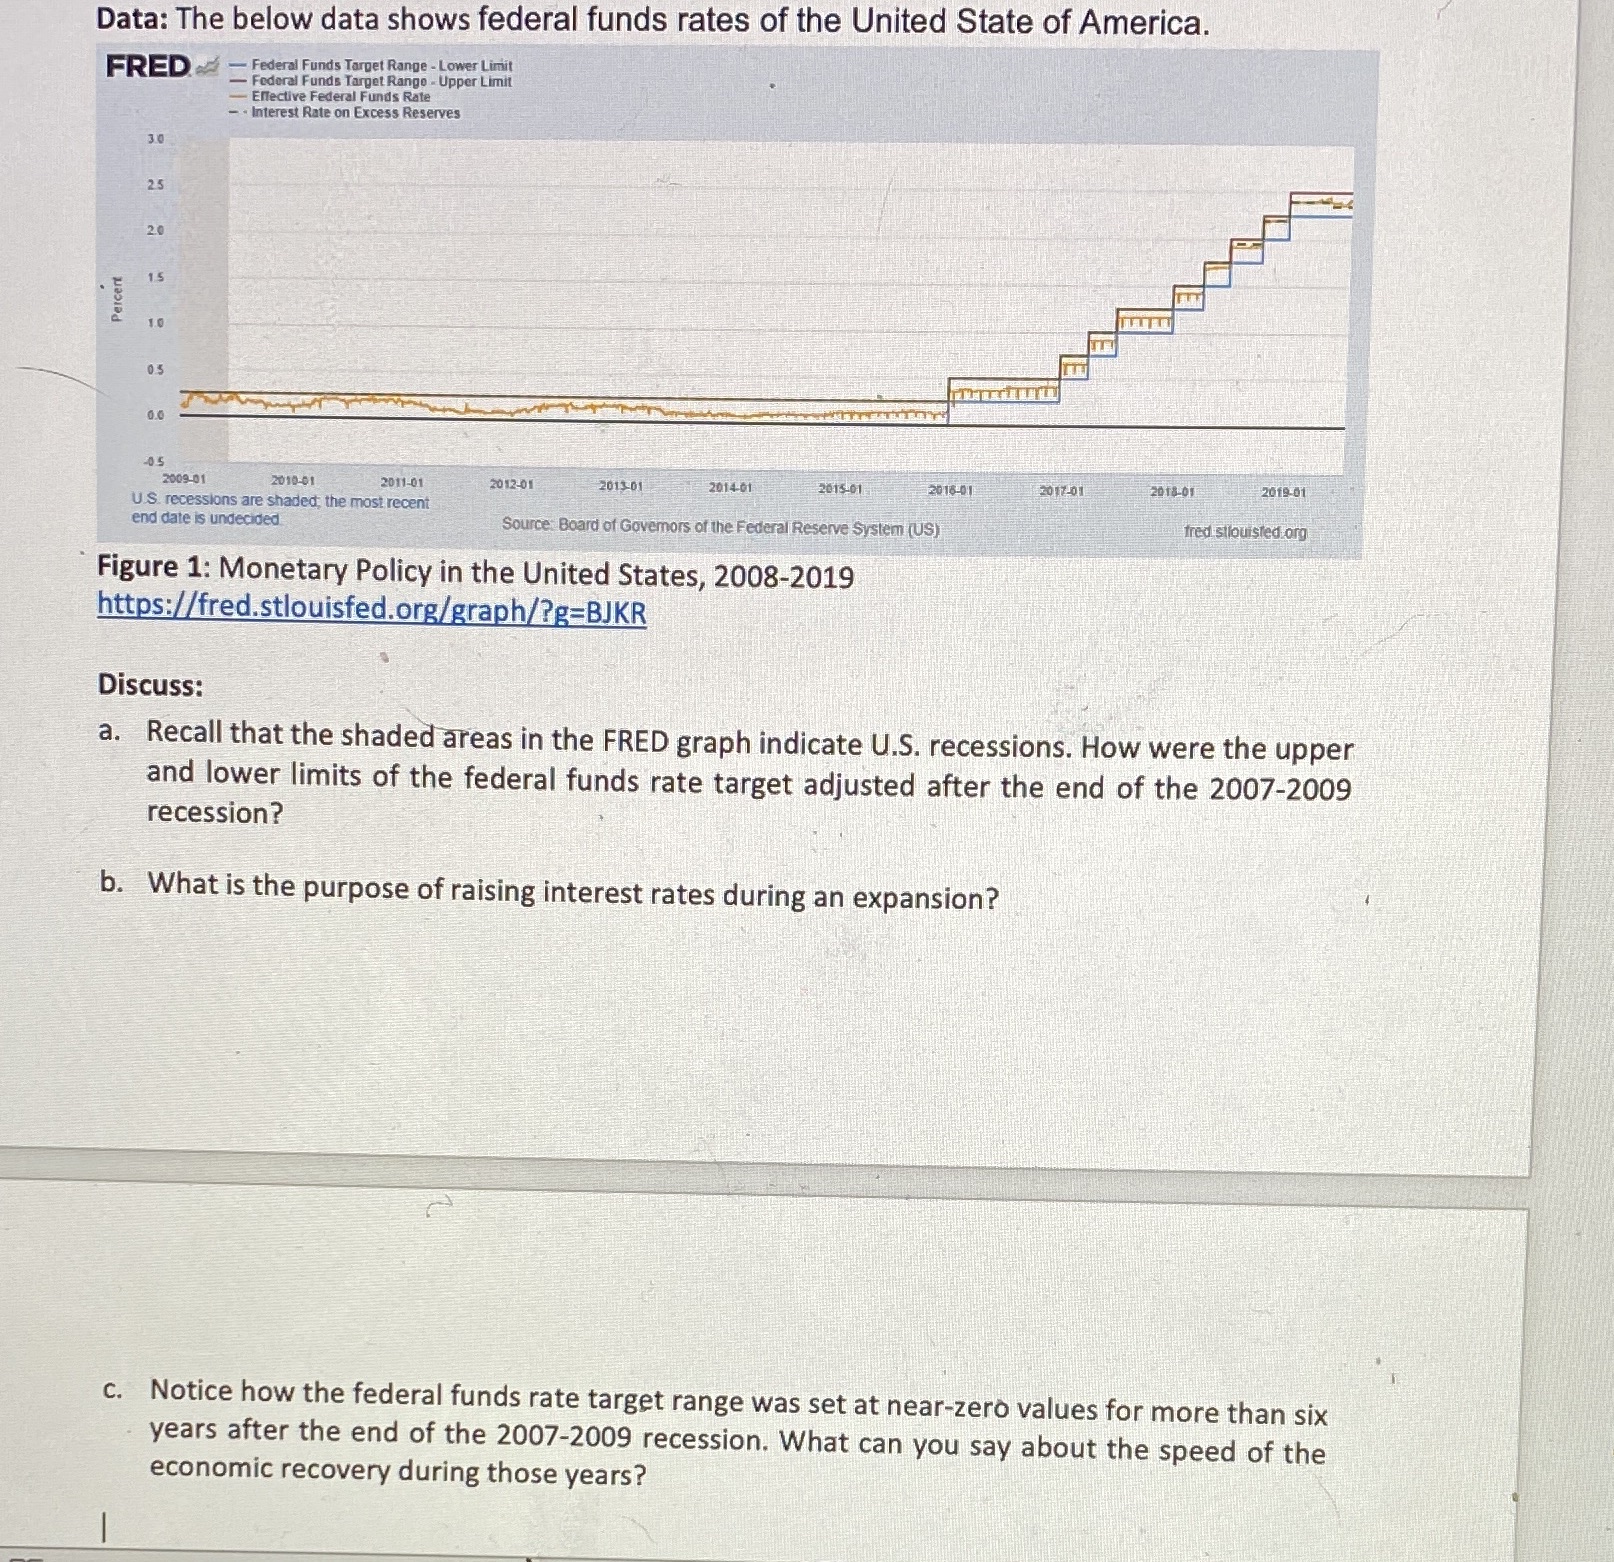
Data: The below data shows federal funds rates of the United State of America. FRED. - Federal Funds Target Range - Lower Limit - Federal Funds Target Range - Upper Limit Effective Federal Funds Rate - . Interest Rate on Excess Reserves 3.0 20 Perce 05 2009-01 2010-01 2011-01 2012-01 2013 01 2014-01 2015.01 2018-01 2017-01 2018-01 2019-01 U.S. recessions are shaded; the most recent end date is undecided Source: Board of Governors of the Federal Reserve System (US) ifred stlouisted.org Figure 1: Monetary Policy in the United States, 2008-2019 https://fred.stlouisfed.org/graph/?g=BJKR Discuss: a. Recall that the shaded areas in the FRED graph indicate U.S. recessions. How were the upper and lower limits of the federal funds rate target adjusted after the end of the 2007-2009 recession? b. What is the purpose of raising interest rates during an expansion? c. Notice how the federal funds rate target range was set at near-zero values for more than six years after the end of the 2007-2009 recession. What can you say about the speed of the economic recovery during those years
Step by Step Solution
There are 3 Steps involved in it

Get step-by-step solutions from verified subject matter experts