

Question: Short Answer Problems 1. Plot the production possibilities curve from the data in the following table. Alternatives ABCDEF Capital goods 100 95 85 70 50
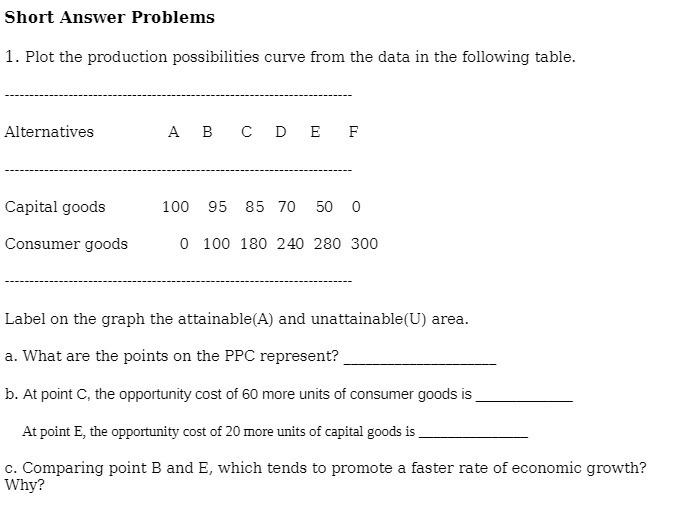
Short Answer Problems 1. Plot the production possibilities curve from the data in the following table. Alternatives ABCDEF Capital goods 100 95 85 70 50 0 Consumer goods 0 100 180 240 280 300 Label on the graph the attainable(A) and unattainable(U) area. a. What are the points on the PPC represent? b. At point C, the opportunity cost of 60 more units of consumer goods is At point E, the opportunity cost of 20 more units of capital goods is c. Comparing point B and E, which tends to promote a faster rate of economic growth? Why
Step by Step Solution
There are 3 Steps involved in it
1 Expert Approved Answer
Step: 1 Unlock

Question Has Been Solved by an Expert!
Get step-by-step solutions from verified subject matter experts
Step: 2 Unlock
Step: 3 Unlock