

Question: short answer response for both these questions please! You are hired as a consultant by the president of ASJS Engineering Inc. He gave you an
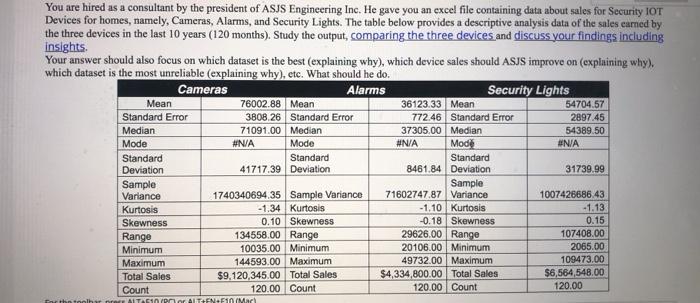
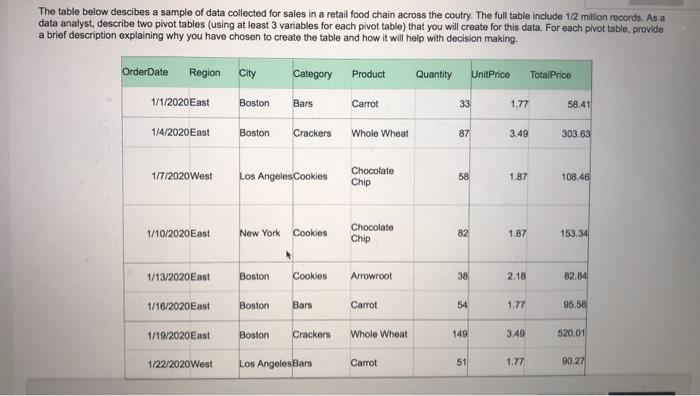
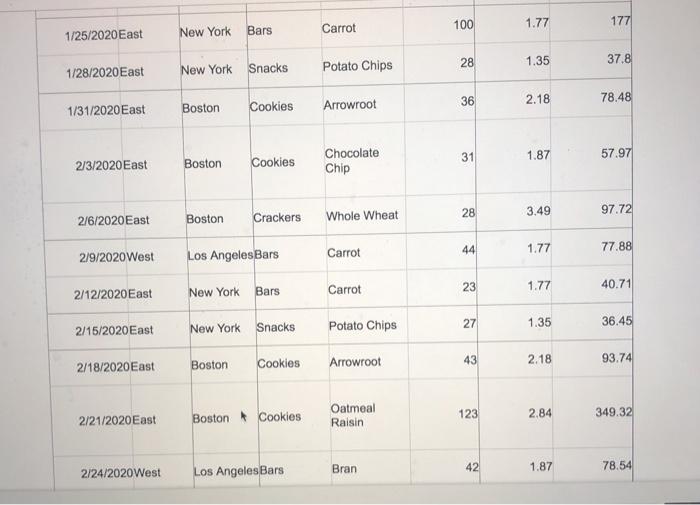
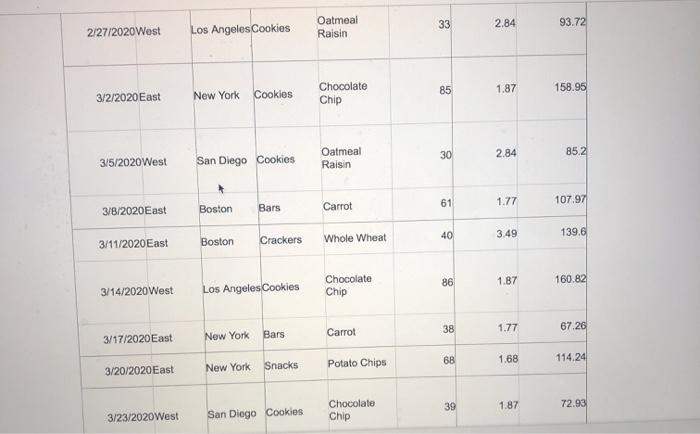
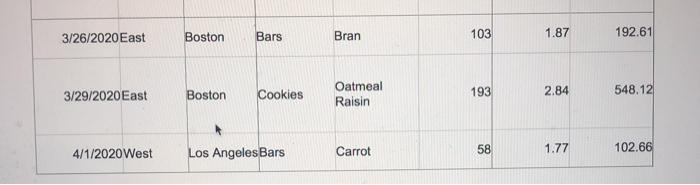
You are hired as a consultant by the president of ASJS Engineering Inc. He gave you an excel file containing data about sales for Security IOT Devices for homes, namely, Cameras, Alarms, and Security Lights. The table below provides a descriptive analysis data of the sales cured by the three devices in the last 10 years (120 months). Study the output, comparing the three devices and discuss your findings including insights Your answer should also focus on which dataset is the best (explaining why), which device sales should ASJS improve on (explaining why). which dataset is the most unreliable (explaining why), etc. What should he do. Cameras Alarms Security Lights Mean 76002.88 Mean 36123.33 Mean 54704.57 Standard Error 3808.26 Standard Error 772.46 Standard Error 2897.45 Median 71091.00 Median 37305.00 Median 54389.50 Mode #N/A Mode #N/A Mode #N/A Standard Standard Standard Deviation 41717.39 Deviation 8461.84 Deviation 31739.99 Sample Sample Variance 1740340694.35 Sample Variance 71602747.87 Variance 1007426686.43 Kurtosis -1.34 Kurtosis -1.10 Kurtosis -1.13 Skewness 0.10 Skewness -0.18 Skewness 0.15 Range 134558.00 Range 29626.00 Range 107408.00 Minimum 10035.00 Minimum 20106.00 Minimum 2065.00 Maximum 144593.00 Maximum 49732.00 Maximum 109473.00 Total Sales $9.120,345.00 Total Sales $4,334,800.00 Total Sales $6,564,548.00 Count 120.00 Count 120.00 Count 120.00 For the inolhar ALT51 por ALTHEN FIn Mart The table below descibes a sample of data collected for sales in a retail food chain across the coutry. The full table include 12 million records. As a data analyst, describe two pivot tables (using at least 3 variables for each pivot table) that you will create for this data. For each pivot table, provide a brief description explaining why you have chosen to create the table and how it will help with decision making. OrderDate Region City Category Product Quantity UnitPrice TotalPrice 1/1/2020East Boston Bars Carrot 33 1.77 58.41 1/4/2020East Boston Crackers Whole Wheat 87 3.49 303.63 1/7/2020West Los Angeles Cookies Chocolate Chip 58 1.87 108.46 1/10/2020 East New York Cookies Chocolate Chip 82 1.87 153.34 1/13/2020East Boston Cookies Arrowroot 38 2.18 82.84 1/16/2020East Boston Bars Carrot 54 1.77 95,58 1/19/2020 East Boston Crackers Whole Wheat 149 3.49 520.01 1/22/2020 West Los Angeles Bars Carrot 51 1.77 90.27 100 1.77 177 Bars Carrot New York 1/25/2020East 28 1.35 37.8 1/28/2020East Potato Chips New York Snacks 36 2.18 78.48 1/31/2020East Boston Cookies Arrowroot 31 1.87 57.97 2/3/2020East Chocolate Chip Boston Cookies 3.49 28 97.72 2/6/2020East Boston Crackers Whole Wheat 44 Carrot 1.77 2/9/2020 West 77.88 Los Angeles Bars 23 1.77 2/12/2020 East Carrot 40.71 New York Bars 27 2/15/2020 East Snacks 36.45 New York Potato Chips 1.35 Cookies 43 2/18/2020 East Arrowroot 2.18 Boston 93.74 123 Oatmeal Raisin 2.84 349.32 2/21/2020East Boston Cookies 42 2/24/2020 West Bran 78.54 Los Angeles Bars 1.87 33 Oatmeal Raisin 2.84 93.72 2/27/2020 West Los Angeles Cookies 85 158.95 1.87 3/2/2020 East Cookies New York Chocolate Chip 30 2.84 85.2 3/5/2020 West Oatmeal Raisin San Diego Cookies 61 1.77 107.97 Carrot 3/8/2020East Boston Bars 3.49 139.6 3/11/2020East Boston 40 Crackers Whole Wheat 86 Chocolate Chip 1.87 160.82 3/14/2020 West Los Angeles Cookies 38 1.77 67.26 3/17/2020 East Carrot New York Bars 68 1.68 114.24 Potato Chips 3/20/2020 East New York Snacks 39 1.87 72.93 Chocolate Chip 3/23/2020 West San Diego Cookies 3/26/2020East Boston Bars Bran 103 1.87 192.61 3/29/2020East Boston Cookies Oatmeal Raisin 2.84 193 548.12 4/1/2020 West Los Angeles Bars Carrot 58 1.77 102.66 You are hired as a consultant by the president of ASJS Engineering Inc. He gave you an excel file containing data about sales for Security IOT Devices for homes, namely, Cameras, Alarms, and Security Lights. The table below provides a descriptive analysis data of the sales cured by the three devices in the last 10 years (120 months). Study the output, comparing the three devices and discuss your findings including insights Your answer should also focus on which dataset is the best (explaining why), which device sales should ASJS improve on (explaining why). which dataset is the most unreliable (explaining why), etc. What should he do. Cameras Alarms Security Lights Mean 76002.88 Mean 36123.33 Mean 54704.57 Standard Error 3808.26 Standard Error 772.46 Standard Error 2897.45 Median 71091.00 Median 37305.00 Median 54389.50 Mode #N/A Mode #N/A Mode #N/A Standard Standard Standard Deviation 41717.39 Deviation 8461.84 Deviation 31739.99 Sample Sample Variance 1740340694.35 Sample Variance 71602747.87 Variance 1007426686.43 Kurtosis -1.34 Kurtosis -1.10 Kurtosis -1.13 Skewness 0.10 Skewness -0.18 Skewness 0.15 Range 134558.00 Range 29626.00 Range 107408.00 Minimum 10035.00 Minimum 20106.00 Minimum 2065.00 Maximum 144593.00 Maximum 49732.00 Maximum 109473.00 Total Sales $9.120,345.00 Total Sales $4,334,800.00 Total Sales $6,564,548.00 Count 120.00 Count 120.00 Count 120.00 For the inolhar ALT51 por ALTHEN FIn Mart The table below descibes a sample of data collected for sales in a retail food chain across the coutry. The full table include 12 million records. As a data analyst, describe two pivot tables (using at least 3 variables for each pivot table) that you will create for this data. For each pivot table, provide a brief description explaining why you have chosen to create the table and how it will help with decision making. OrderDate Region City Category Product Quantity UnitPrice TotalPrice 1/1/2020East Boston Bars Carrot 33 1.77 58.41 1/4/2020East Boston Crackers Whole Wheat 87 3.49 303.63 1/7/2020West Los Angeles Cookies Chocolate Chip 58 1.87 108.46 1/10/2020 East New York Cookies Chocolate Chip 82 1.87 153.34 1/13/2020East Boston Cookies Arrowroot 38 2.18 82.84 1/16/2020East Boston Bars Carrot 54 1.77 95,58 1/19/2020 East Boston Crackers Whole Wheat 149 3.49 520.01 1/22/2020 West Los Angeles Bars Carrot 51 1.77 90.27 100 1.77 177 Bars Carrot New York 1/25/2020East 28 1.35 37.8 1/28/2020East Potato Chips New York Snacks 36 2.18 78.48 1/31/2020East Boston Cookies Arrowroot 31 1.87 57.97 2/3/2020East Chocolate Chip Boston Cookies 3.49 28 97.72 2/6/2020East Boston Crackers Whole Wheat 44 Carrot 1.77 2/9/2020 West 77.88 Los Angeles Bars 23 1.77 2/12/2020 East Carrot 40.71 New York Bars 27 2/15/2020 East Snacks 36.45 New York Potato Chips 1.35 Cookies 43 2/18/2020 East Arrowroot 2.18 Boston 93.74 123 Oatmeal Raisin 2.84 349.32 2/21/2020East Boston Cookies 42 2/24/2020 West Bran 78.54 Los Angeles Bars 1.87 33 Oatmeal Raisin 2.84 93.72 2/27/2020 West Los Angeles Cookies 85 158.95 1.87 3/2/2020 East Cookies New York Chocolate Chip 30 2.84 85.2 3/5/2020 West Oatmeal Raisin San Diego Cookies 61 1.77 107.97 Carrot 3/8/2020East Boston Bars 3.49 139.6 3/11/2020East Boston 40 Crackers Whole Wheat 86 Chocolate Chip 1.87 160.82 3/14/2020 West Los Angeles Cookies 38 1.77 67.26 3/17/2020 East Carrot New York Bars 68 1.68 114.24 Potato Chips 3/20/2020 East New York Snacks 39 1.87 72.93 Chocolate Chip 3/23/2020 West San Diego Cookies 3/26/2020East Boston Bars Bran 103 1.87 192.61 3/29/2020East Boston Cookies Oatmeal Raisin 2.84 193 548.12 4/1/2020 West Los Angeles Bars Carrot 58 1.77 102.66
Step by Step Solution
There are 3 Steps involved in it

Get step-by-step solutions from verified subject matter experts