

Question: Short Answer1 and 2 Name: ID: A Short Answer 1. (5 marks) Using each graph of y = f(x), sketch the graph of g(x): y
Short Answer1 and 2
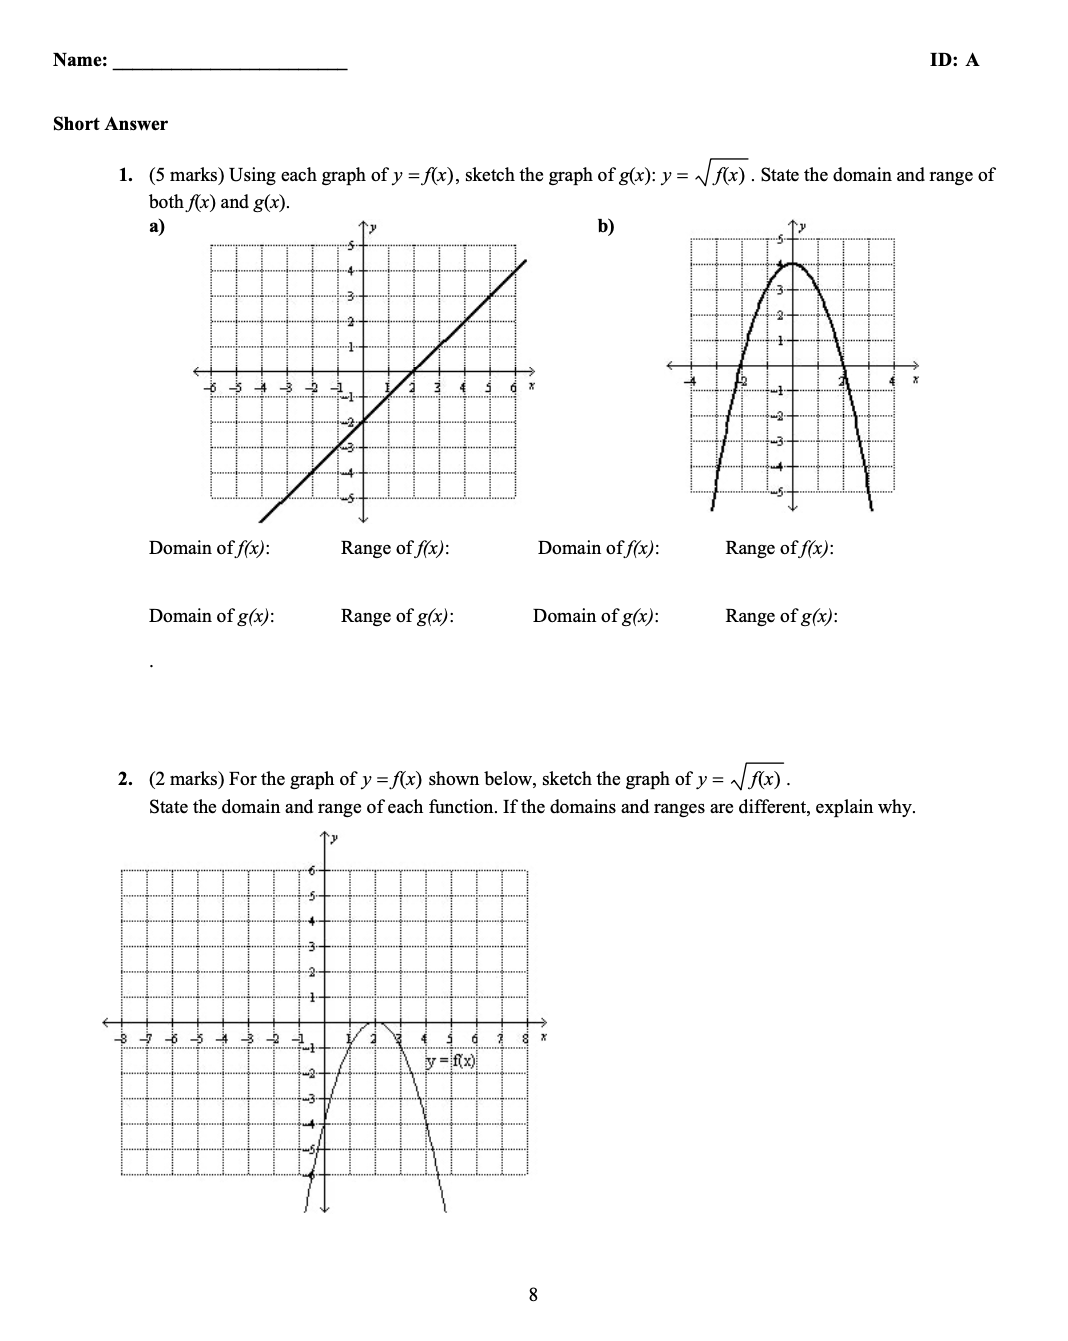
Name: ID: A Short Answer 1. (5 marks) Using each graph of y = f(x), sketch the graph of g(x): y = f(x) . State the domain and range of both f(x) and g(x). a) b) Domain of f(x): Range of f(x): Domain of f(x): Range of f(x): Domain of g(x): Range of g(x): Domain of g(x): Range of g(x): 2. (2 marks) For the graph of y = f(x) shown below, sketch the graph of y = f(x) . State the domain and range of each function. If the domains and ranges are different, explain why. by =f(x) 8
Step by Step Solution
There are 3 Steps involved in it
1 Expert Approved Answer
Step: 1 Unlock

Question Has Been Solved by an Expert!
Get step-by-step solutions from verified subject matter experts
Step: 2 Unlock
Step: 3 Unlock