

Question: Short report documenting the results. describe the high level logic and design of the program(s), how it is installed and executed and how it is
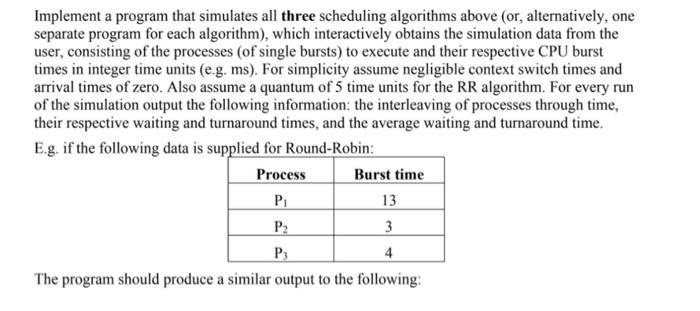
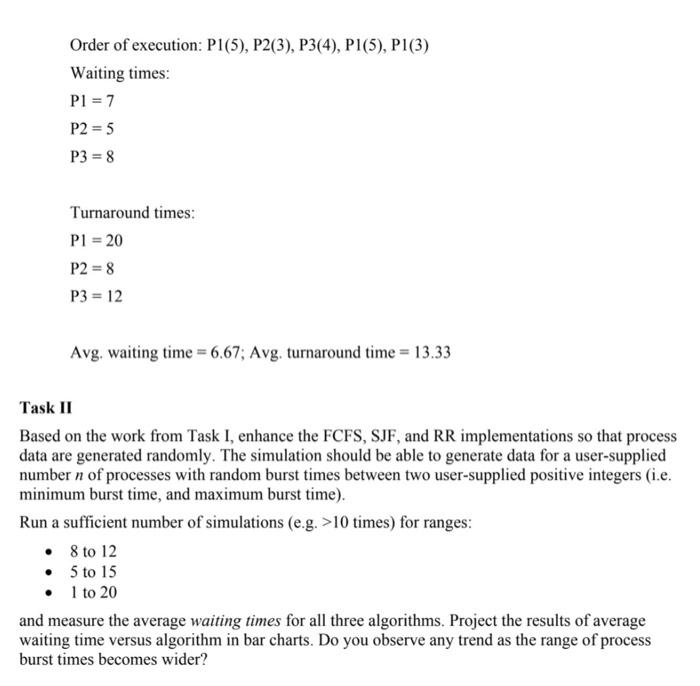
Implement a program that simulates all three scheduling algorithms above (or, alternatively, one separate program for each algorithm), which interactively obtains the simulation data from the user, consisting of the processes (of single bursts) to execute and their respective CPU burst times in integer time units (e.g. ms). For simplicity assume negligible context switch times and arrival times of zero. Also assume a quantum of 5 time units for the RR algorithm. For every run of the simulation output the following information: the interleaving of processes through time, their respective waiting and turnaround times, and the average waiting and turnaround time. E.g. if the following data is supplied for Round-Robin: The program should produce a similar output to the following: Order of execution: P1(5),P2(3),P3(4),P1(5),P1(3) Waiting times: P1=7P2=5P3=8 Turnaround times: P1=20P2=8P3=12 Avg. waiting time =6.67; Avg. turnaround time =13.33 Task II Based on the work from Task I, enhance the FCFS, SJF, and RR implementations so that process data are generated randomly. The simulation should be able to generate data for a user-supplied number n of processes with random burst times between two user-supplied positive integers (i.e. minimum burst time, and maximum burst time). Run a sufficient number of simulations (e.g. >10 times) for ranges: - 8 to 12 - 5 to 15 - 1 to 20 and measure the average waiting times for all three algorithms. Project the results of average waiting time versus algorithm in bar charts. Do you observe any trend as the range of process burst times becomes wider
Step by Step Solution
There are 3 Steps involved in it

Get step-by-step solutions from verified subject matter experts