

Question: should be on the same diagram, with 1 1 . 7 Using the soil profile in Figure 1 1 . 2 9 , develop a
should be on the same diagram, with
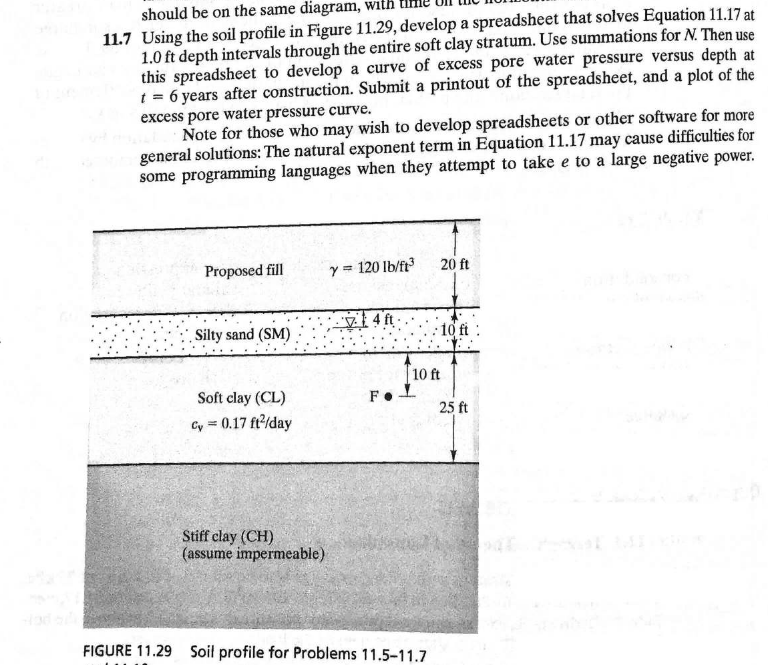
Using the soil profile in Figure develop a spreadsheet that solves Equation at
depth intervals through the entire soft clay stratum. Use summations for Then use
this spreadsheet to develop a curve of excess pore water pressure versus depth at
years after construction. Submit a printout of the spreadsheet, and a plot of the
excess pore water pressure curve.
Note for those who may wish to develop spreadsheets or other software for more
general solutions: The natural exponent term in Equation may cause difficulties for
some programming languages when they attempt to take to a large negative power.
FIGURE Soil profile for Problems please give the whole excel table and with shown formula for correct answer
Step by Step Solution
There are 3 Steps involved in it
1 Expert Approved Answer
Step: 1 Unlock

Question Has Been Solved by an Expert!
Get step-by-step solutions from verified subject matter experts
Step: 2 Unlock
Step: 3 Unlock