

Question: ------- Should Burton raise additional capital through a private placement? Raising Capital by Issuing New Common Stock Marshall knew that Burton had to raise additional
 -------
Should Burton raise additional capital through a private placement?
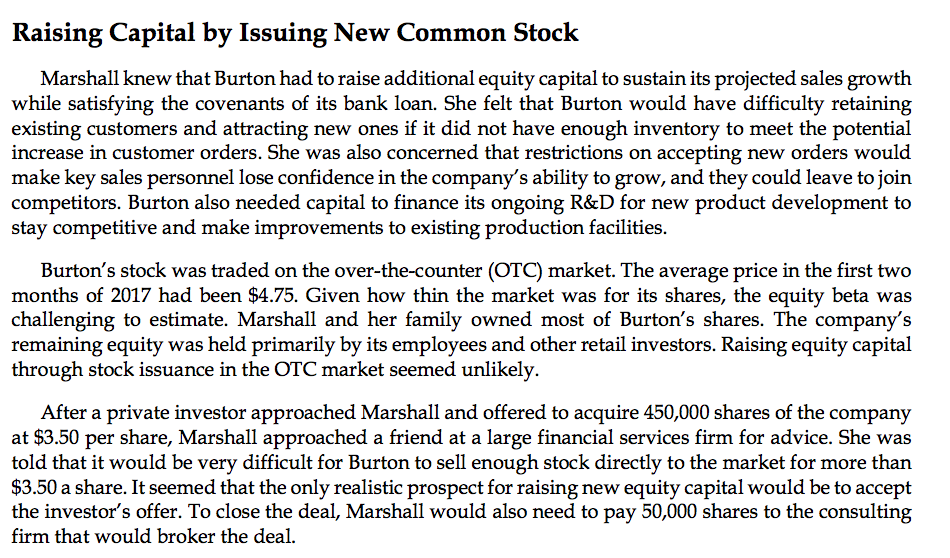
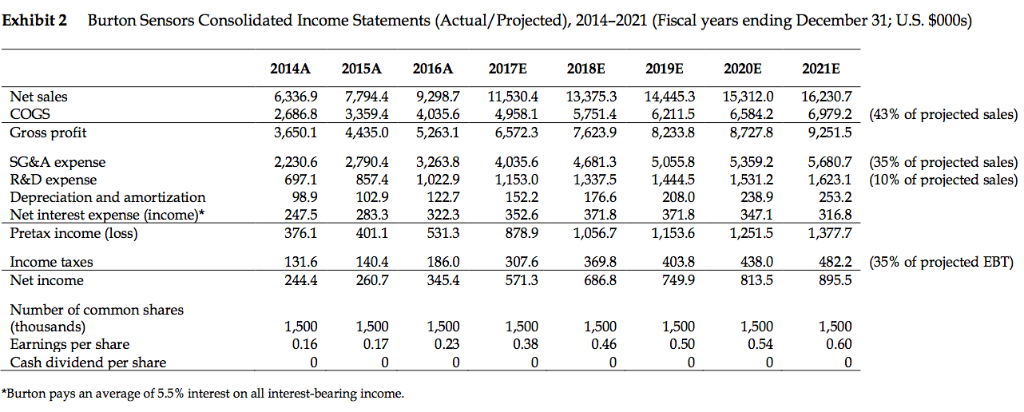
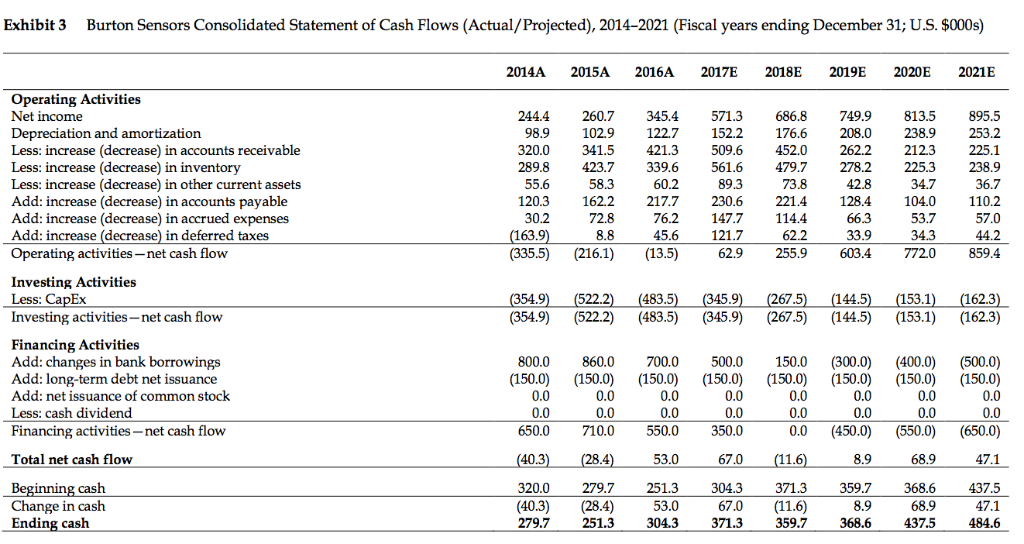
Raising Capital by Issuing New Common Stock Marshall knew that Burton had to raise additional equity capital to sustain its projected sales growth while satisfying the covenants of its bank loan. She felt that Burton would have difficulty retaining existing customers and attracting new ones if it did not have enough inventory to meet the potential increase in customer orders. She was also concerned that restrictions on accepting new orders would make key sales personnel lose confidence in the company's ability to grow, and they could leave to join competitors. Burton also needed capital to finance its ongoing R&D for new product development to stay competitive and make improvements to existing production facilities. Burton's stock was traded on the over-the-counter (OTC) market. The average price in the first two months of 2017 had been $4.75. Given how thin the market was for its shares, the equity beta was challenging to estimate. Marshall and her family owned most of Burton's shares. The company's remaining equity was held primarily by its employees and other retail investors. Raising equity capital through stock issuance in the OTC market seemed unlikely. After a private investor approached Marshall and offered to acquire 450,000 shares of the company at $3.50 per share, Marshall approached a friend at a large financial services firm for advice. She was told that it would be very difficult for Burton to sell enough stock directly to the market for more than $3.50 a share. It seemed that the only realistic prospect for raising new equity capital would be to accept the investor's offer. To close the deal, Marshall would also need to pay 50,000 shares to the consulting firm that would broker the deal. Exhibit 2 Burton Sensors Consolidated Income Statements (Actual/Projected), 2014-2021 (Fiscal years ending December 31; U.S. $000s) 2014A 2015A 2016A 2017E 2018E 2019E 2020E 2021E Net sales COGS Gross profit 6,336.9 7,794.49,298.7 11,530.4 13,375.3 14,445.3 15,312.0 16,230.7 26868 3,359.4 4,035.6 4,958.1 5751.4 6,211.5 6,5842 6,979.2(43% of projected sales) 3,650. 4,435.0 5,263.16,572.3 7,623.98,233.8 8,7278 9,251.5 2,230.6 2,7904 32638 4,0356 4,681.3 5,055.8 5,3592 5,680.7 (35% of projected sales) SG&A expense R&D expense Depreciation and amortization Net interest exp Pretax income (loss) 697.1 857.4 1,022.9 1,153.0 1,3375 1,4445 1,531.2 1.6231 (10% ofprojected sales) 152.2 352.6 208.0 371.8 878.91,056.71,153.6 1,251.51,377.7 176.6 371.8 238.9 347.1 253.2 316.8 98.9 247.5 102.9 283.3 401.1 122.7 322.3 531.3 376.1 131.6 244.4 307.6 571.3 369.8 686.8 Income taxes Net income 140.4 260.7345.4 186.0 403.8 749.9 438.0 813.5 482.2 895.5 (35% of projected EBT Number of common shares (thousands) Earnings per share Cash dividend per share 1,500 0.16 1,500 0.17 1,500 0.23 1,500 0.38 1,500 0.46 1,500 0.50 1,500 0.54 1,500 0.60 "Burton pays an average of 5.5% interest on all interest-bearing income Exhibit 3 Burton Sensors Consolidated Statement of Cash Flows (Actual/Projected), 2014-2021 (Fiscal years ending December 31; U.S. $000s) 2014A 2015A 2016A 2017E 2018E 2019E 2020E 2021E Operating Activities Net income Depreciation and amortization Less: increase (decrease) in accounts receivable Less: increase (decrease) in inventory Less: increase (decrease) in other current assets Add: increase (decrease) in accounts payable Add: increase (decrease) in accrued expenses Add: increase (decrease) in deferred taxes Operating activities-net cash flow 244.4 260.7345.4 571.3 686.8 749.9 813.5 895.5 98.9 102.9 122.7 152.2 176.6 208.0 238.9 253.2 320.0 341.5 421.3 509.6 452.0262.2 212.3 225.1 289.8 423.7 339.6 561.6 479.7278.2 225.3 238.9 36.7 120.3 162.2217.7 230.6 221.4128.4 104.0 110.2 57.0 44.2 (335.5) (216.1)(13.5) 62.9 255.9 603.4 772.0 859.4 55.6 58.3 60.2 89.3 73.8 42.8 34.7 53.7 34.3 30.2 163.9 72.8 8.8 76.2147.7114.4 121.7 66.3 33.9 62.2 45.6 Investing Activities Less: CapEx Investing activities-net cash flow 162.3 (354.9) (522.2) (483.5) (345.9) (267.5) (144.5) (153.1) (162.3) 522.2 (483.5 267.5 144.5 153.1 Financing Activities Add: changes in bank borrowings Add: long-term debt net issuance Add: net issuance of common s Less: cash dividend Financing activities-net cash flow 800.0 860.0 700.0 500.0150.0 (300.0) (400.0 (500.0) (150.0) (150.0) (150.0) (150.0) (150.0) (150.0) (150.0) (150.0) 0.0 0.0 0.0 (450.0) (550.0) (650.0) 0.0 0.0 650.0710.0 550.0 350.0 0.0 0.0 0.0 0.0 0.0 0.0 0.0 0.0 0.0 0.0 0.0 0.0 47.1 Total net cash flow 40.3 53.0 67.0 8.9 68.9 320.0 279.7 251.3 304.3 371.3 359.7 368.6 437.5 47.1 279.7 251.3 304.3 371.3 359.7 368.6 437.5 484.6 nning cash Change in cash Ending cash (40.3) (28.4) 53.067.0(11.6) 8.9 68.9 Raising Capital by Issuing New Common Stock Marshall knew that Burton had to raise additional equity capital to sustain its projected sales growth while satisfying the covenants of its bank loan. She felt that Burton would have difficulty retaining existing customers and attracting new ones if it did not have enough inventory to meet the potential increase in customer orders. She was also concerned that restrictions on accepting new orders would make key sales personnel lose confidence in the company's ability to grow, and they could leave to join competitors. Burton also needed capital to finance its ongoing R&D for new product development to stay competitive and make improvements to existing production facilities. Burton's stock was traded on the over-the-counter (OTC) market. The average price in the first two months of 2017 had been $4.75. Given how thin the market was for its shares, the equity beta was challenging to estimate. Marshall and her family owned most of Burton's shares. The company's remaining equity was held primarily by its employees and other retail investors. Raising equity capital through stock issuance in the OTC market seemed unlikely. After a private investor approached Marshall and offered to acquire 450,000 shares of the company at $3.50 per share, Marshall approached a friend at a large financial services firm for advice. She was told that it would be very difficult for Burton to sell enough stock directly to the market for more than $3.50 a share. It seemed that the only realistic prospect for raising new equity capital would be to accept the investor's offer. To close the deal, Marshall would also need to pay 50,000 shares to the consulting firm that would broker the deal. Exhibit 2 Burton Sensors Consolidated Income Statements (Actual/Projected), 2014-2021 (Fiscal years ending December 31; U.S. $000s) 2014A 2015A 2016A 2017E 2018E 2019E 2020E 2021E Net sales COGS Gross profit 6,336.9 7,794.49,298.7 11,530.4 13,375.3 14,445.3 15,312.0 16,230.7 26868 3,359.4 4,035.6 4,958.1 5751.4 6,211.5 6,5842 6,979.2(43% of projected sales) 3,650. 4,435.0 5,263.16,572.3 7,623.98,233.8 8,7278 9,251.5 2,230.6 2,7904 32638 4,0356 4,681.3 5,055.8 5,3592 5,680.7 (35% of projected sales) SG&A expense R&D expense Depreciation and amortization Net interest exp Pretax income (loss) 697.1 857.4 1,022.9 1,153.0 1,3375 1,4445 1,531.2 1.6231 (10% ofprojected sales) 152.2 352.6 208.0 371.8 878.91,056.71,153.6 1,251.51,377.7 176.6 371.8 238.9 347.1 253.2 316.8 98.9 247.5 102.9 283.3 401.1 122.7 322.3 531.3 376.1 131.6 244.4 307.6 571.3 369.8 686.8 Income taxes Net income 140.4 260.7345.4 186.0 403.8 749.9 438.0 813.5 482.2 895.5 (35% of projected EBT Number of common shares (thousands) Earnings per share Cash dividend per share 1,500 0.16 1,500 0.17 1,500 0.23 1,500 0.38 1,500 0.46 1,500 0.50 1,500 0.54 1,500 0.60 "Burton pays an average of 5.5% interest on all interest-bearing income Exhibit 3 Burton Sensors Consolidated Statement of Cash Flows (Actual/Projected), 2014-2021 (Fiscal years ending December 31; U.S. $000s) 2014A 2015A 2016A 2017E 2018E 2019E 2020E 2021E Operating Activities Net income Depreciation and amortization Less: increase (decrease) in accounts receivable Less: increase (decrease) in inventory Less: increase (decrease) in other current assets Add: increase (decrease) in accounts payable Add: increase (decrease) in accrued expenses Add: increase (decrease) in deferred taxes Operating activities-net cash flow 244.4 260.7345.4 571.3 686.8 749.9 813.5 895.5 98.9 102.9 122.7 152.2 176.6 208.0 238.9 253.2 320.0 341.5 421.3 509.6 452.0262.2 212.3 225.1 289.8 423.7 339.6 561.6 479.7278.2 225.3 238.9 36.7 120.3 162.2217.7 230.6 221.4128.4 104.0 110.2 57.0 44.2 (335.5) (216.1)(13.5) 62.9 255.9 603.4 772.0 859.4 55.6 58.3 60.2 89.3 73.8 42.8 34.7 53.7 34.3 30.2 163.9 72.8 8.8 76.2147.7114.4 121.7 66.3 33.9 62.2 45.6 Investing Activities Less: CapEx Investing activities-net cash flow 162.3 (354.9) (522.2) (483.5) (345.9) (267.5) (144.5) (153.1) (162.3) 522.2 (483.5 267.5 144.5 153.1 Financing Activities Add: changes in bank borrowings Add: long-term debt net issuance Add: net issuance of common s Less: cash dividend Financing activities-net cash flow 800.0 860.0 700.0 500.0150.0 (300.0) (400.0 (500.0) (150.0) (150.0) (150.0) (150.0) (150.0) (150.0) (150.0) (150.0) 0.0 0.0 0.0 (450.0) (550.0) (650.0) 0.0 0.0 650.0710.0 550.0 350.0 0.0 0.0 0.0 0.0 0.0 0.0 0.0 0.0 0.0 0.0 0.0 0.0 47.1 Total net cash flow 40.3 53.0 67.0 8.9 68.9 320.0 279.7 251.3 304.3 371.3 359.7 368.6 437.5 47.1 279.7 251.3 304.3 371.3 359.7 368.6 437.5 484.6 nning cash Change in cash Ending cash (40.3) (28.4) 53.067.0(11.6) 8.9 68.9
Step by Step Solution
There are 3 Steps involved in it

Get step-by-step solutions from verified subject matter experts