

Question: Should look like the bottom picture FLOW CHART Problem READ THIS PROGRAM ovER SEVERAL TIMES that Flow chart the problem that NOT coDE. Your how
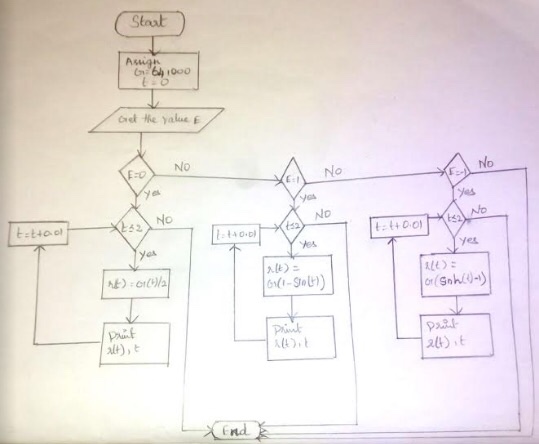
FLOW CHART Problem READ THIS PROGRAM ovER SEVERAL TIMES that Flow chart the problem that NOT coDE. Your how well you sh the flow chart represents structure grade will depend on are represented in the chart (show of this program and basic calculations and logical expressions cosmology the the formulas used below in the and proper flowchart symbols are used. related to time behavior of space through time is by chart) called the scale factor r(t). The variable behaviors of and has the range o to 2 radians interval o 01. The Freedman model predicts possible matter the scale factor depending upon estimates three amount depends on a of the amount of matter in the universe. The G(sinh (t) -1) and factor known as Eupsilon) being 0, 1 or-1. with E aro then t) Gt/2, with E -1 r(tj The program will with E t1 then rtt Gu1 sin G is related to Newton's constant and 640' start by asking the user for the epsilon value only from which an output and t will be produced from the appropriate formula for the range oft values. The program should terminate when the rar t is finished. HINT:. Reflected in the flow chart must be the wHILE Ioop and if -elseif else structures for full crew SUGGESTION: USE PENCIL & LEAVE PLENTYoF RooM and show the connecting lines with flow direction in the chart
Step by Step Solution
There are 3 Steps involved in it

Get step-by-step solutions from verified subject matter experts