

Question: Show all calculations, work, and graphs needed to answer the question. Section 2. Short Answer Questions Q1. Assume the economy is initially represented by the
Show all calculations, work, and graphs needed to answer the question.
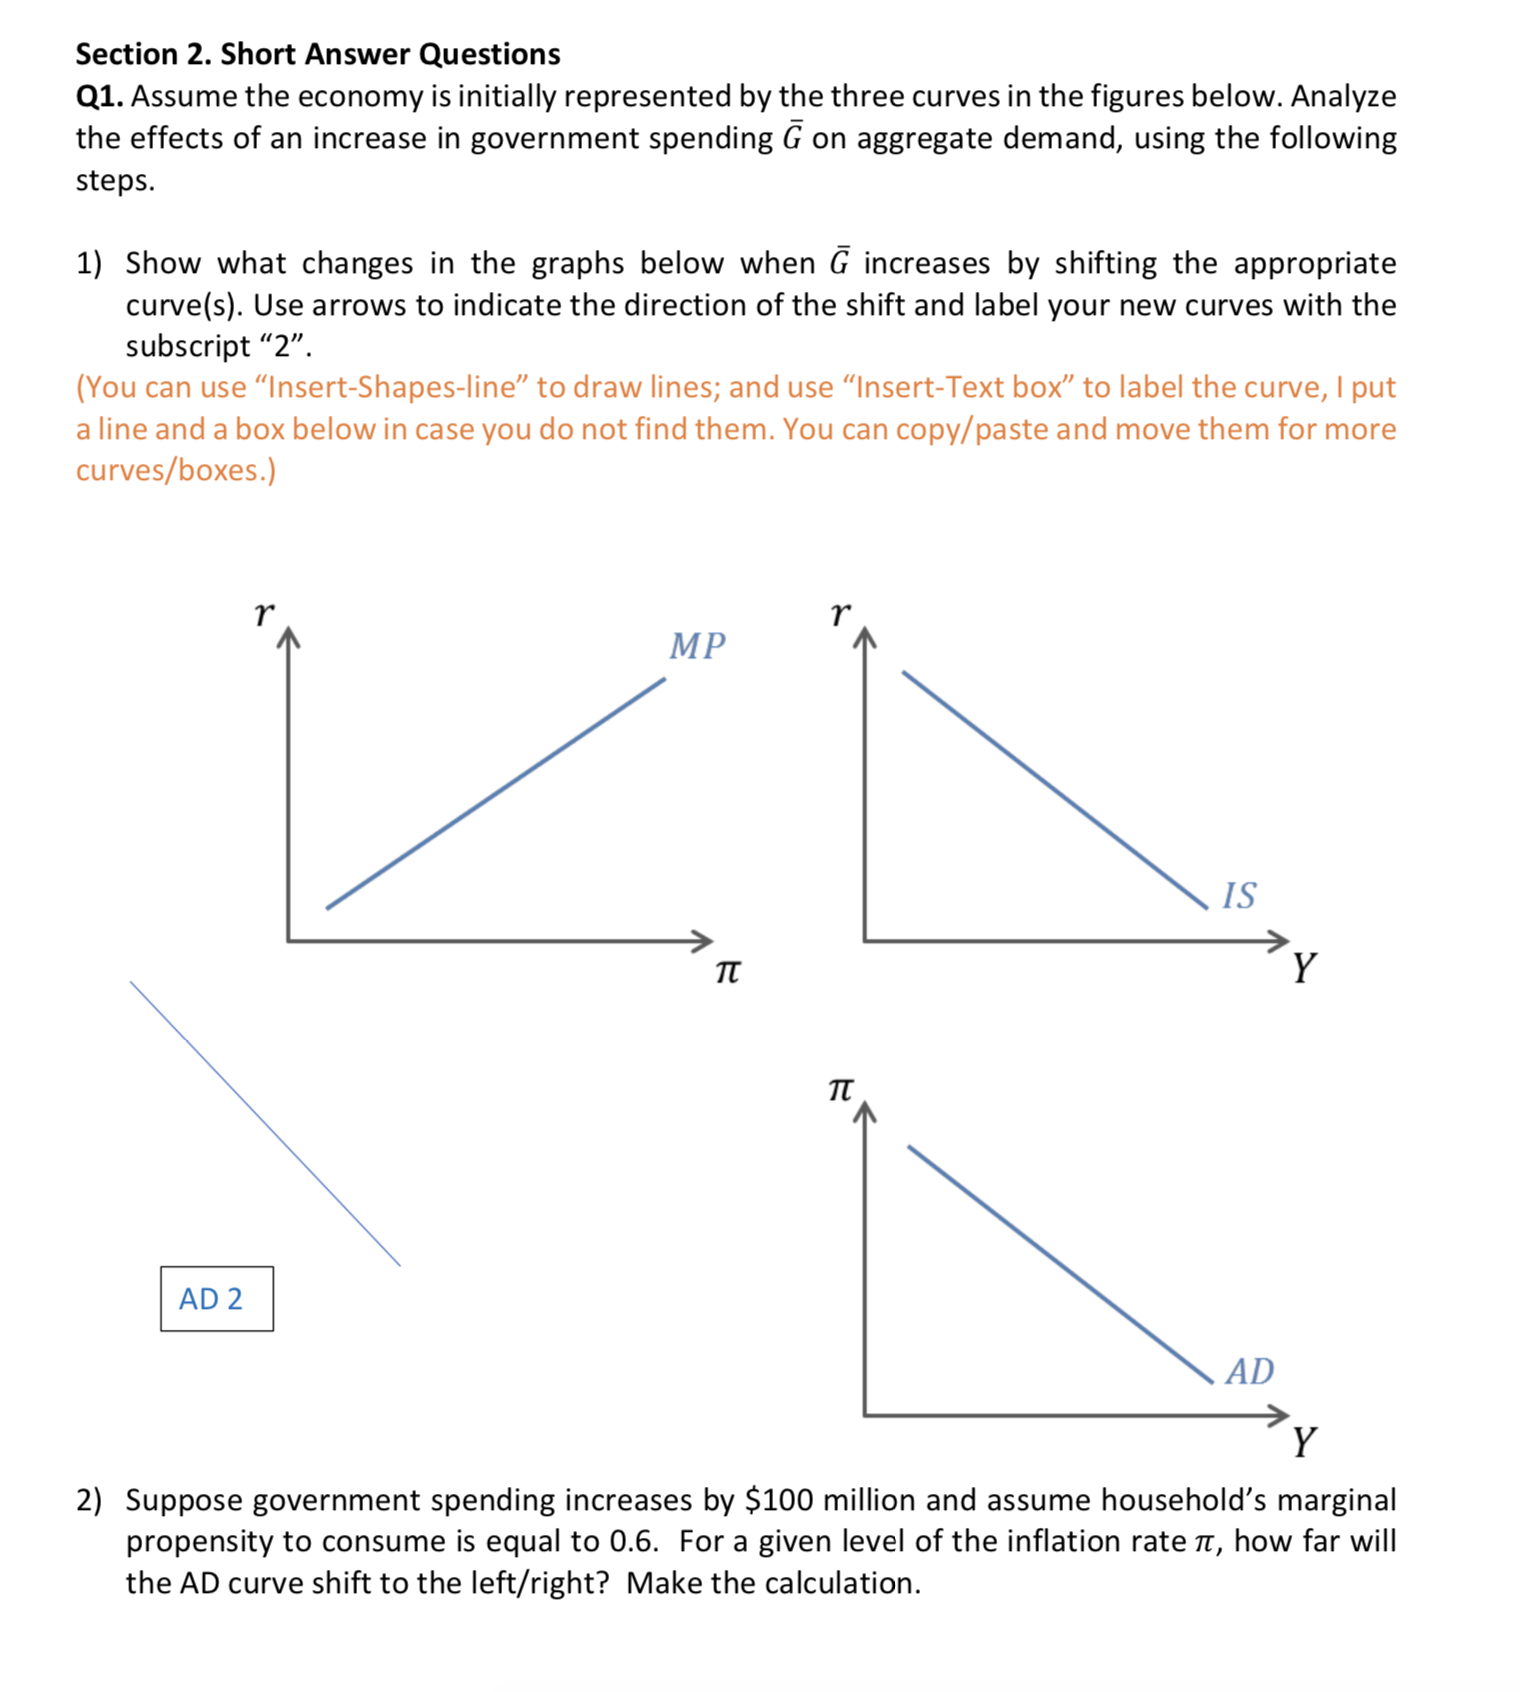
Section 2. Short Answer Questions Q1. Assume the economy is initially represented by the three curves in the figures below. Analyze the effects of an increase in government spending G on aggregate demand, using the following steps. 1) Show what changes in the graphs below when 6- increases by shifting the appropriate curvels). Use arrows to indicate the direction of the shift and label your new curves with the subscript \"2\". (You can use \"Insert-Shapes-line\" to draw lines; and use \"Insert-Text box\" to label the curve, I put a line and a box below in case you do not find them. You can copy/paste and move them for more curves/boxes.) MP 15 AD 2 AD Y 2) Suppose government spending increases by $100 million and assume household's marginal propensity to consume is equal to 0.6. For a given level of the inflation rate 11', how far will the AD curve shift to the left/right? Make the calculation
Step by Step Solution
There are 3 Steps involved in it

Get step-by-step solutions from verified subject matter experts