

Question: Show All Detailed Work please ! Using the tables below.conduct a complete radio analysis of the Garten Company for the youn 2018 and 2010. You
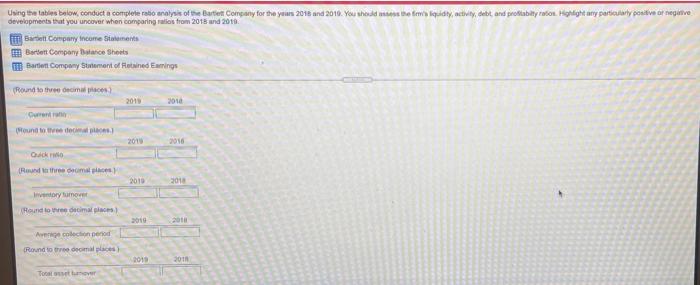
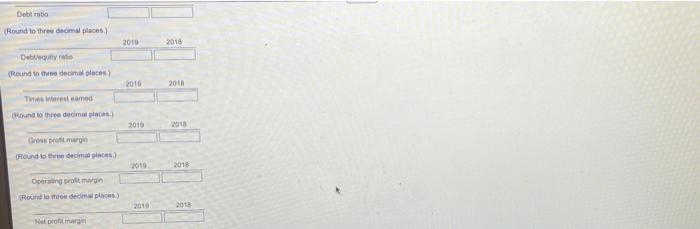
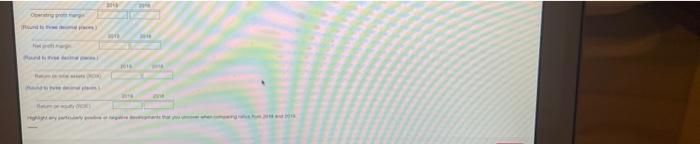
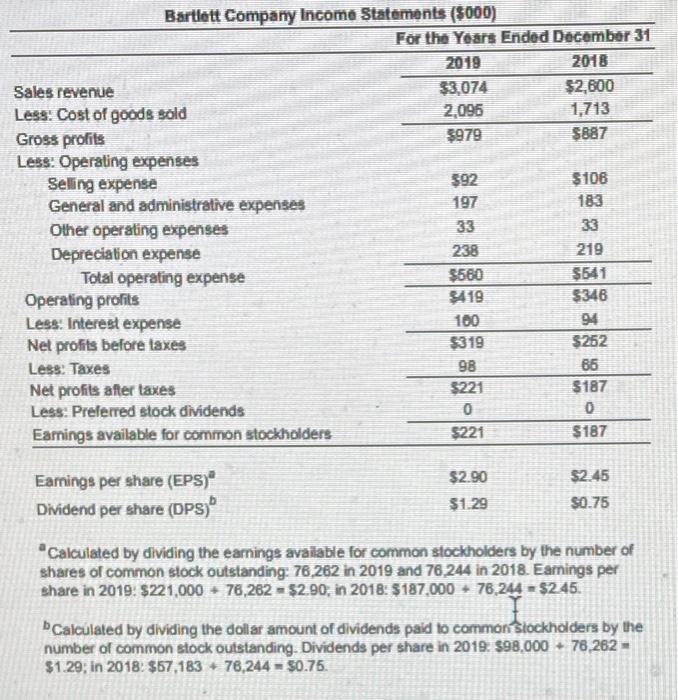
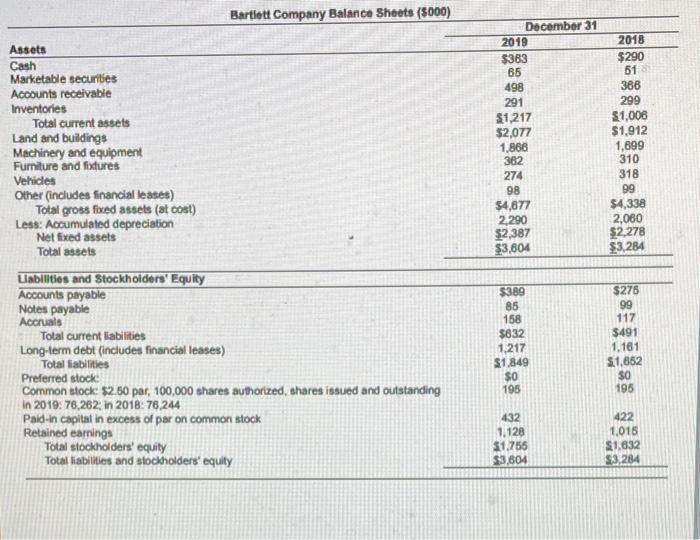
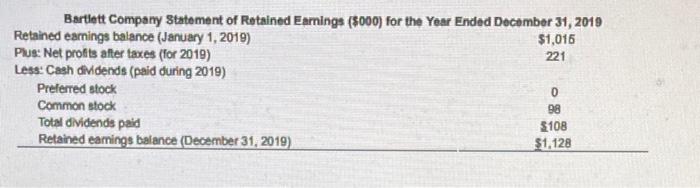
Using the tables below.conduct a complete radio analysis of the Garten Company for the youn 2018 and 2010. You should be the few kiday, activity, debt and profitabilty raton. Highlight any particularly positivo ar negative comparing from and Bare Company Income Barent company Balance Sheets i Bartlett Company Statement of Retained Emmings Round to three decimales 2015 2010 Fount to 2011 2010 Quick Round the small 2010 2011 Indary tumot Round to decimal Arcolection period Round to the places 2012 2018 Tour Debratio (Round to three decimal places 2010 2016 Debeurt Round to the decades 2010 2018 The whereamed Round to the decimales 2010 2018 Cross profit margin Rount to emplaces) 2010 2011 Opening Brottmargin Round to the decimos) 2013 2013 profit margin Bartlett Company Income Statements (5000) For the Years Ended December 31 2019 2018 Sales revenue $3.074 $2,600 Less: Cost of goods sold 2,096 1,713 Gross profils $979 $887 Less: Operating expenses Seling expense 592 $106 General and administrative expenses 197 183 Other operating expenses 33 Depreciation expense 238 219 Total operating expense $560 $541 Operating profils 9419 $346 Less: Interest expense 100 94 Net profits before taxes $319 $252 Less: Taxes 98 66 Net profits after taxes $221 $187 Less: Preferred stock dividends 0 0 Earnings available for common stockholders $221 $187 $2.90 Earnings per share (EPS) Dividend per share (DPS) $2.45 $0.75 $1.29 Calculated by dividing the earnings available for common stockholders by the number of shares of common stock outstanding: 78,282 in 2019 and 76,244 in 2018. Earnings per share in 2019: $221,000 - 76,262 = $2.90, in 2018: $187.000 - 76,244 = $245. Calculated by dividing the dollar amount of dividends paid to common Stockholders by the number of common stock outstanding. Dividends per share in 2019. $98,000 + 78,262 - $1.29; in 2018: $67,183 + 76,244 = $0.75. Bartlett Company Balance Sheets (5000) Assets Cash Marketable securities Accounts receivable Inventories Total current assets Land and buildings Machinery and equipment Fumiture and fixtures Vehicles Other (includes financial leases) Total gross fixed assets (at cost) Less: Accumulated depreciation Net fixed assets Total assets December 31 2019 $363 65 498 291 $1,217 $2,077 1,868 362 274 98 $4,677 2.290 $2,387 $3,604 2018 $290 61 386 299 $1,006 $1,912 1,699 310 318 99 $4,338 2,080 $2,278 $3,284 Labilities and Stockholders' Equity Accounts payable Notes payable Accruals Total current liabilities Long-term debt (includes financial leases) Total liabilities Preferred stock Common stock $2.50 par, 100,000 shares authorized, shares issued and outstanding in 2019: 76,262, in 2018: 76244 Paid-in capital in excess of par on common stock Retained earnings Total stockholders' equity Total liabilities and stockholders' equity $389 85 158 $832 1.217 $1.849 SO 195 $278 99 117 $491 1.161 $1,652 $0 195 432 1,128 $1,756 $3,604 422 1,016 $1.632 $3,284 Bartlett Company Statement of Retained Earnings (5000) for the Year Ended December 31, 2019 Retained earnings balance (January 1, 2019) $1,016 Plus: Net profits after taxes (for 2019) 221 Less: Cash dividends (paid during 2019) Preferred stock Common stock 98 Total dividends paid $108 Retained earnings balance (December 31, 2019) $1,128 0
Step by Step Solution
There are 3 Steps involved in it

Get step-by-step solutions from verified subject matter experts