

Question: Show all MATLAB codes and explain solutions as asked in the question. Thanks MATLAB exercise with uniform random variables a. Generate two sets of uniformly
Show all MATLAB codes and explain solutions as asked in the question. Thanks 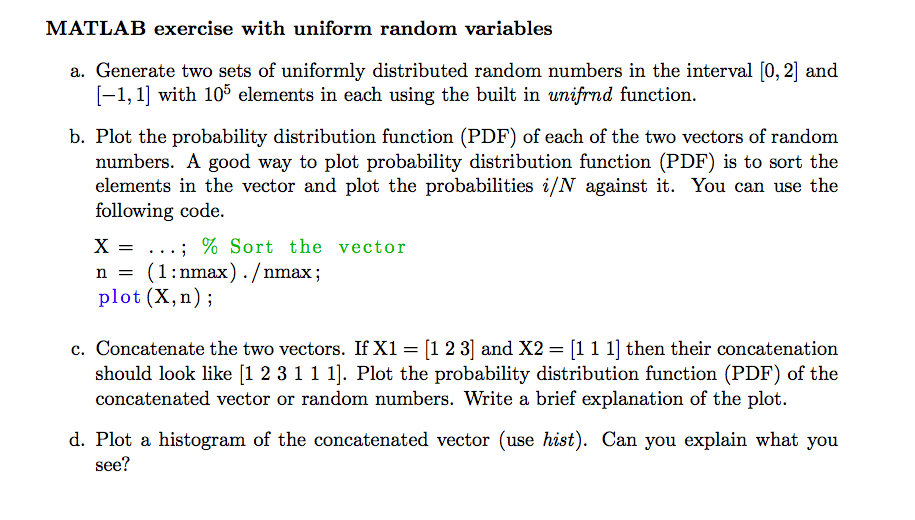
MATLAB exercise with uniform random variables a. Generate two sets of uniformly distributed random numbers in the interval [0, 2] and [-1,1 with 10 elements in each using the built in unifrnd function. b. Plot the probability distribution function (PDF) of each of the two vectors of random numbers. A good way to plot probability distribution function (PDF) is to sort the elements in the vector and plot the probabilities i/N against it. You can use the following code. % Sort the vector n-(1:nmax) . max; plot (X, n); c. Concatenate the two vectors. If X1 = [1 2 3] and X2 = [1 1 11 then their concatenation should look like [1 2 3 1 1 1]. Plot the probability distribution function (PDF) of the concatenated vector or random numbers. Write a brief explanation of the plot. d. Plot a histogram of the concatenated vector (use hist). Can you explain what you see
Step by Step Solution
There are 3 Steps involved in it

Get step-by-step solutions from verified subject matter experts