

Question: Show all processes and label graphs 1. The oxygen consumption, in milliliters per minute per kilogram, of 13 heart patients were recorded during an exercise
Show all processes and label graphs
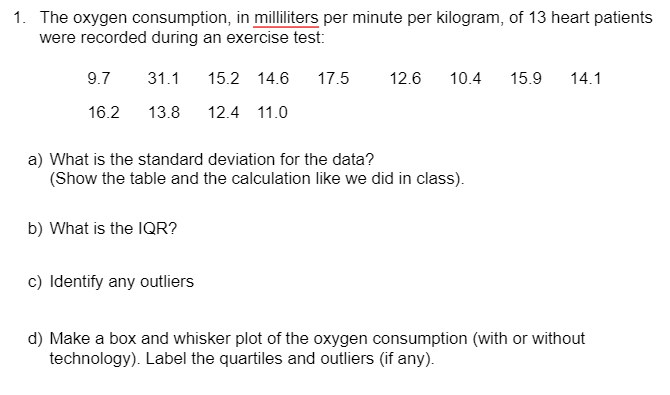
1. The oxygen consumption, in milliliters per minute per kilogram, of 13 heart patients were recorded during an exercise test: 9.? 31.1 15.2 14.5 1T5 12.6 10.4 15.9 14.1 15.2 13.3 12.4 11.0 a} What is the standard deviation for the data? {Show the table and the calculation like we did in class). lo) What is the IQR? c} Identify any outliers d) Make a box and whisker plot of the oxygen consumption {with or without technology). Label the quartiles and outliers (it any)
Step by Step Solution
There are 3 Steps involved in it
1 Expert Approved Answer
Step: 1 Unlock

Question Has Been Solved by an Expert!
Get step-by-step solutions from verified subject matter experts
Step: 2 Unlock
Step: 3 Unlock