

Question: Show ALL relevant workings for maximum marks and clearly write your name and ID on each page of your answer script Clear, tidy and accurate
Show ALL relevant workings for maximum marks and clearly write your name and ID on each page of your answer script
Clear, tidy and accurate calculations with correct unit values are required
Without Special Circumstances deduction for up to a week late, zero marks after a week.
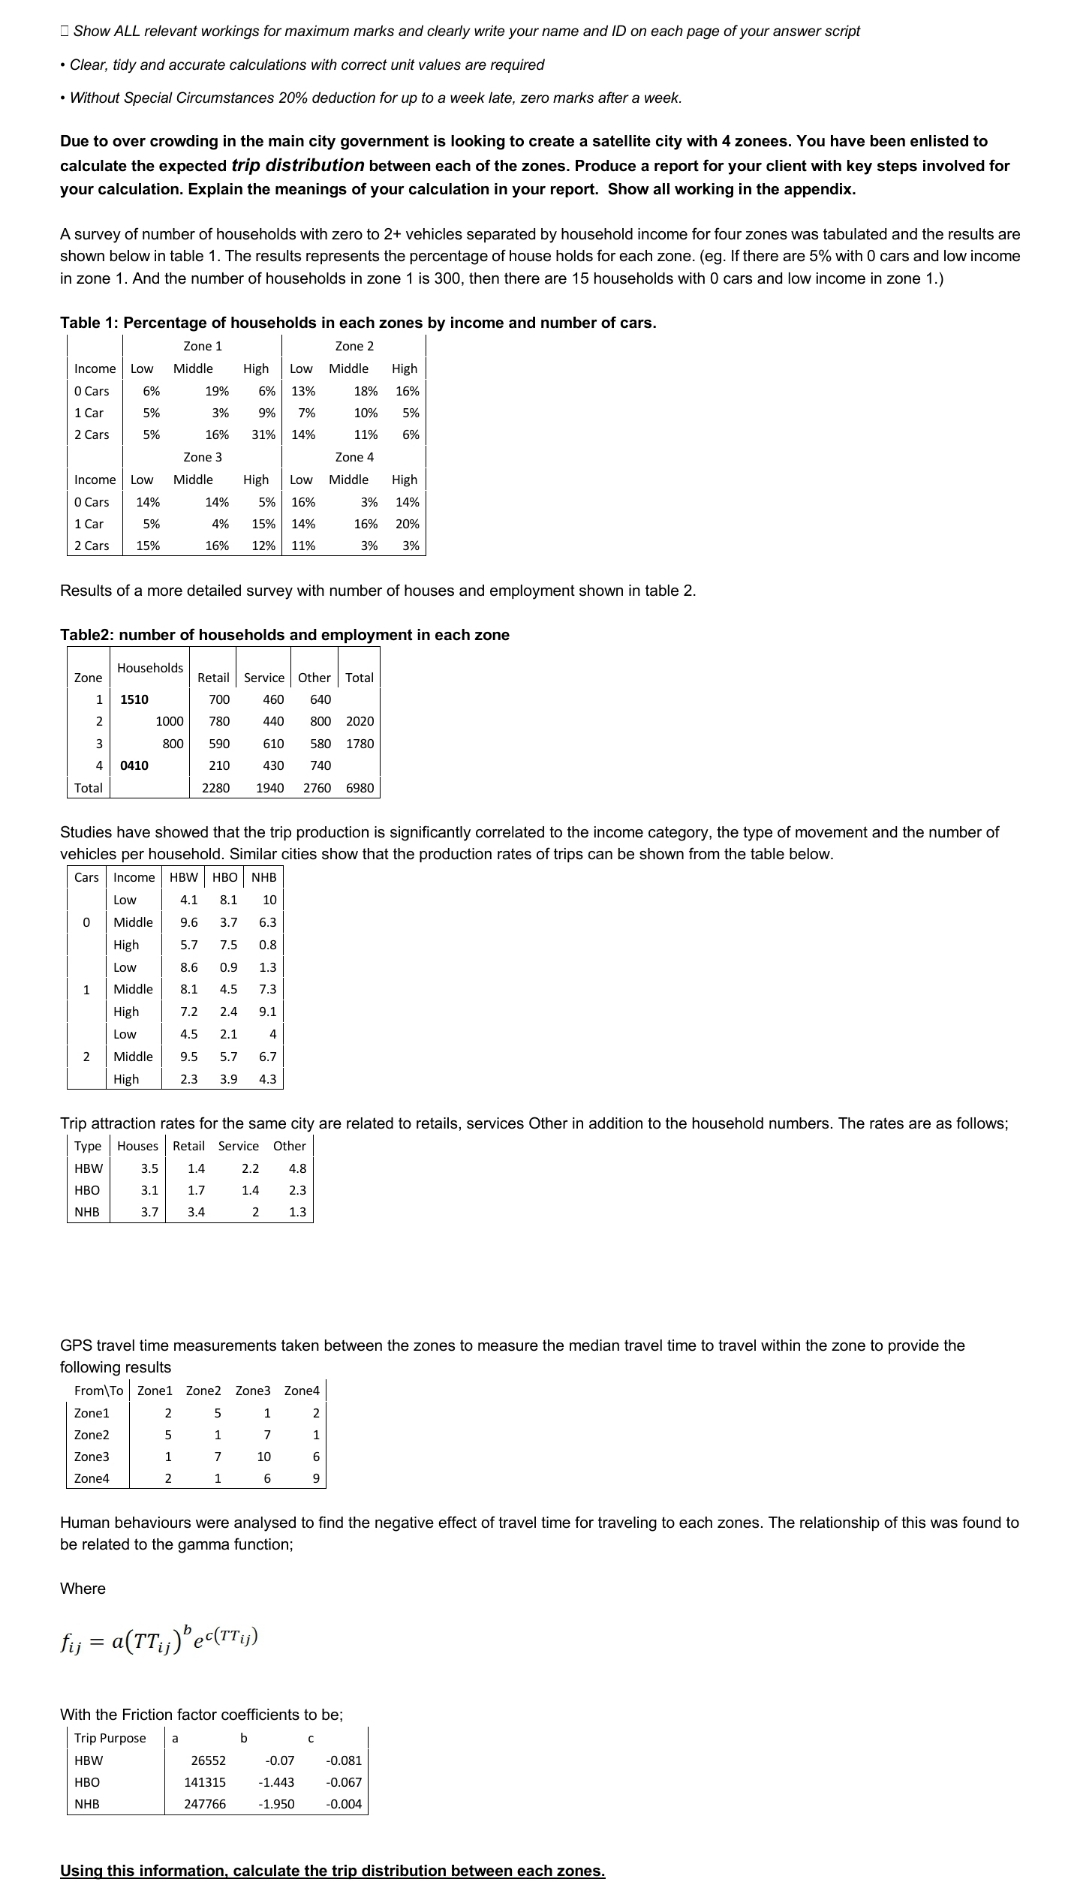
Due to over crowding in the main city government is looking to create a satellite city with zonees. You have been enlisted to calculate the expected trip distribution between each of the zones. Produce a report for your client with key steps involved for your calculation. Explain the meanings of your calculation in your report. Show all working in the appendix.
A survey of number of households with zero to vehicles separated by household income for four zones was tabulated and the results are shown below in table The results represents the percentage of house holds for each zone. eg If there are with cars and low income in zone And the number of households in zone is then there are households with cars and low income in zone
Table : Percentage of households in each zones by income and number of cars.
tableZone Zone IncomeLow,Middle,High,Low,Middle,High,, Cars, Car, Cars,Zone Zone IncomeLow,Middle,High,Low,Middle,High,, Cars, Car, Cars,
Results of a more detailed survey with number of houses and employment shown in table
Table: number of households and employment in each zone
tableZoneHouseholds,Retail,Service,Other,Total,Total
Studies have showed that the trip production is significantly correlated to the income category, the type of movement and the number of vehicles per household. Similar cities show that the production rates of trips can be shown from the table below.
tableCarsIncome,HBWHBO,NHBLowMiddleHighLow,MiddleHighLowMiddle,High,
Trip attraction rates for the same city are related to retails, services Other in addition to the household numbers. The rates are as follows;
tableTypeHouses,Retail,Service,OtherHBWHBONHB
GPS travel time measurements taken between the zones to measure the median travel time to travel within the zone to provide the following results
tableFromToZoneZoneZoneZoneZoneZoneZoneZone
Human behaviours were analysed to find the negative effect of travel time for traveling to each zones. The relationship of this was found to be related to the gamma function;
Where
With the Friction factor coefficients to be;
tableTrip Purpose,
Step by Step Solution
There are 3 Steps involved in it
1 Expert Approved Answer
Step: 1 Unlock

Question Has Been Solved by an Expert!
Get step-by-step solutions from verified subject matter experts
Step: 2 Unlock
Step: 3 Unlock