

Question: Show all the following data in a table: the original data of Table 1. % Change in sales year over year for categories: retail sales:
-
Show all the following data in a table:
-
the original data of Table 1.
-
% Change in sales year over year for categories: retail sales: clothing and clothing accessory and retail sales
-
% of retail sales: clothing and clothing accessory in retail sales year over year.
-
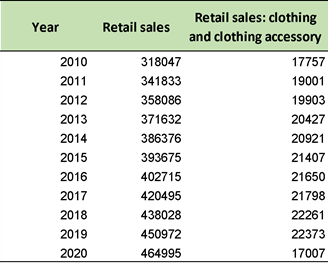
Year Retail sales 2010 2011 2012 2013 2014 2015 2016 2017 2018 2019 2020 318047 341833 358086 371632 386376 393675 402715 420495 438028 450972 Retail sales: clothing and clothing accessory 17757 19001 19903 20427 20921 21407 21650 21798 22261 22373 17007 464995
Step by Step Solution
There are 3 Steps involved in it
1 Expert Approved Answer
Step: 1 Unlock

Question Has Been Solved by an Expert!
Get step-by-step solutions from verified subject matter experts
Step: 2 Unlock
Step: 3 Unlock