

Question: show all the working Do the following on the data below using BOTH years: a) Vertical analysis b) horizontal analysis Statement of Financial Position As
show all the working Do the following on the data below using BOTH years: a) Vertical analysis b) horizontal analysis
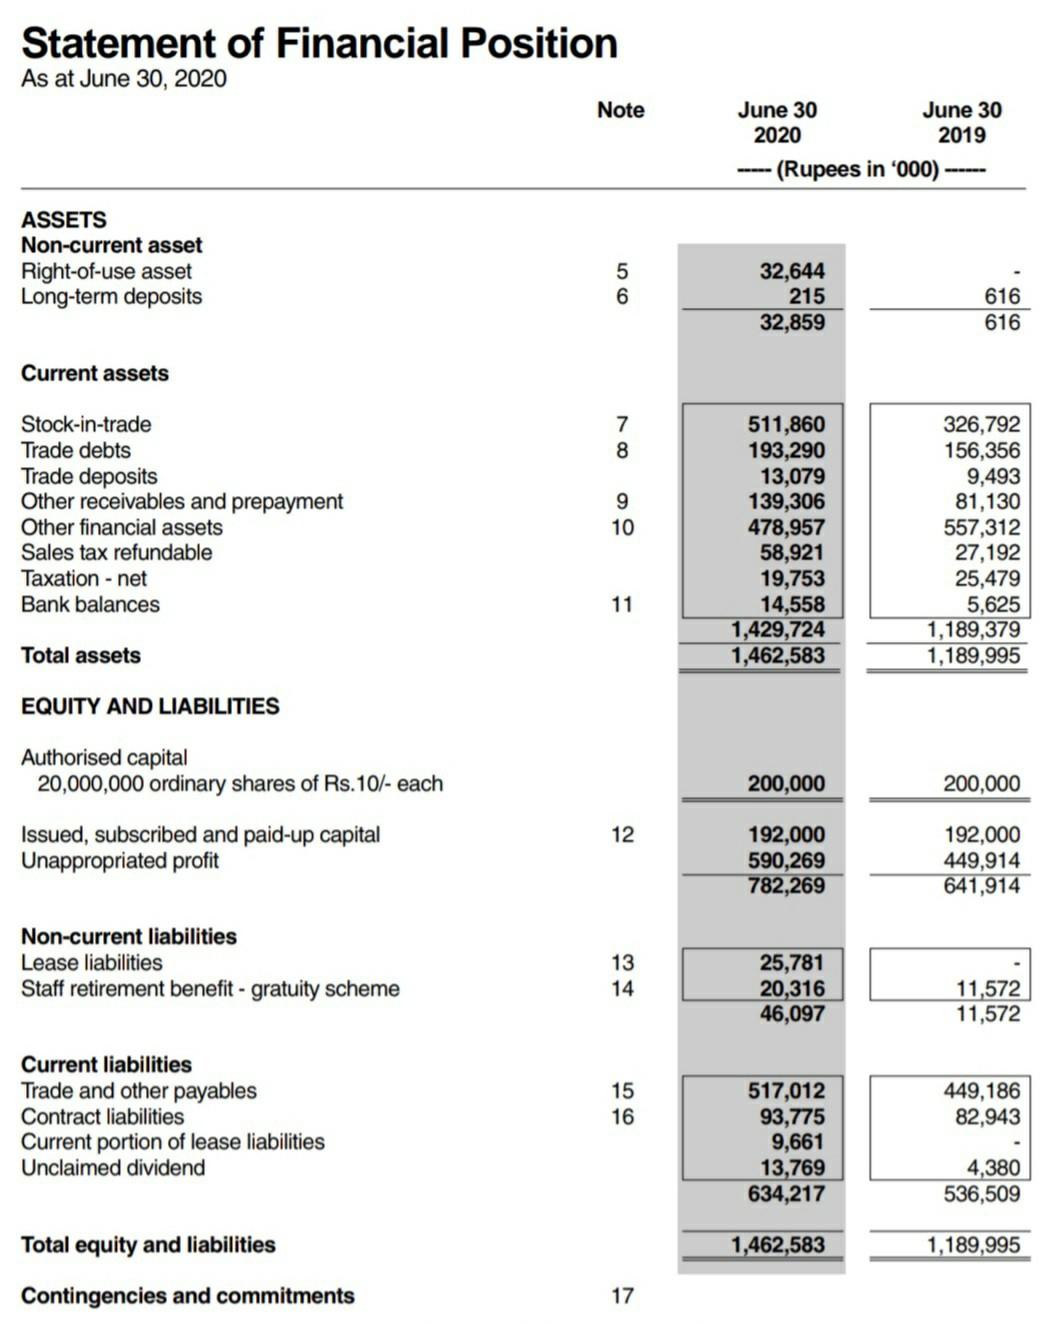
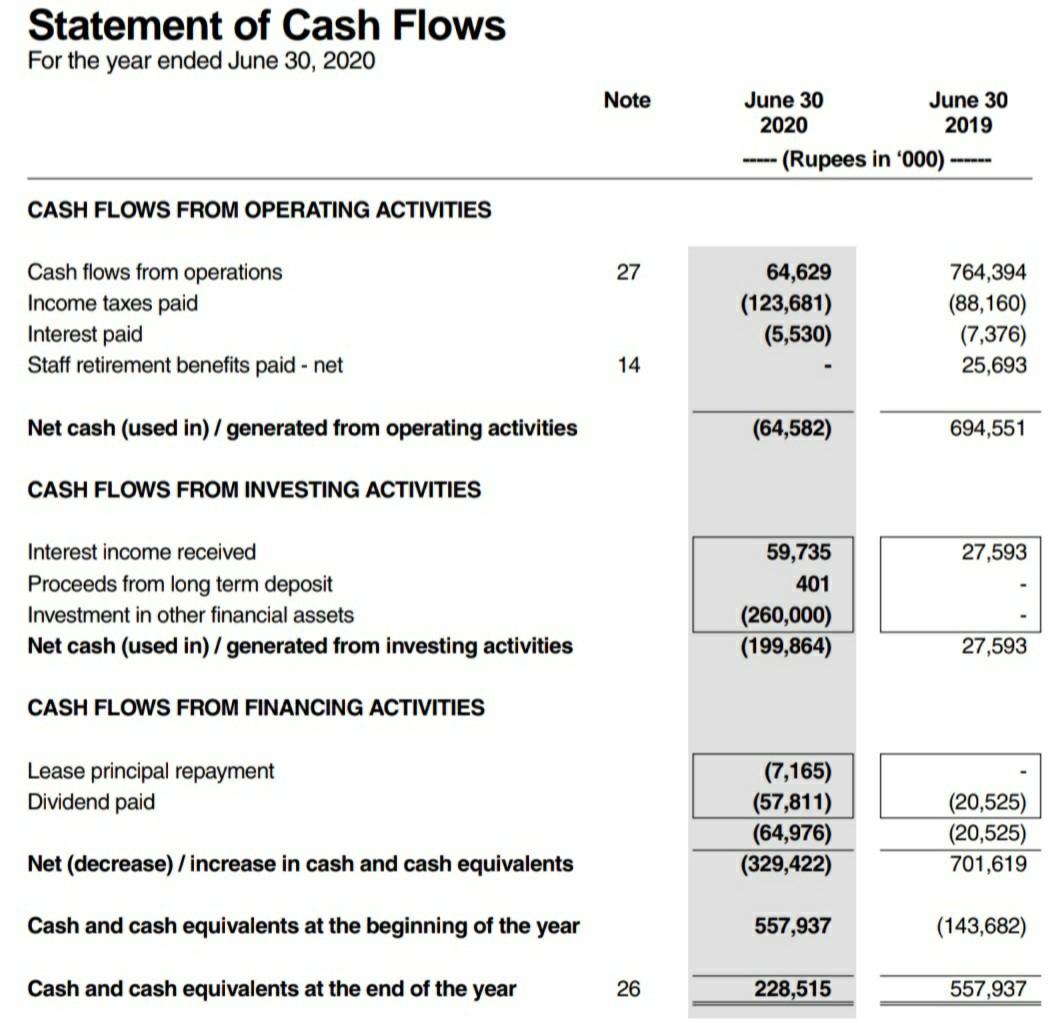
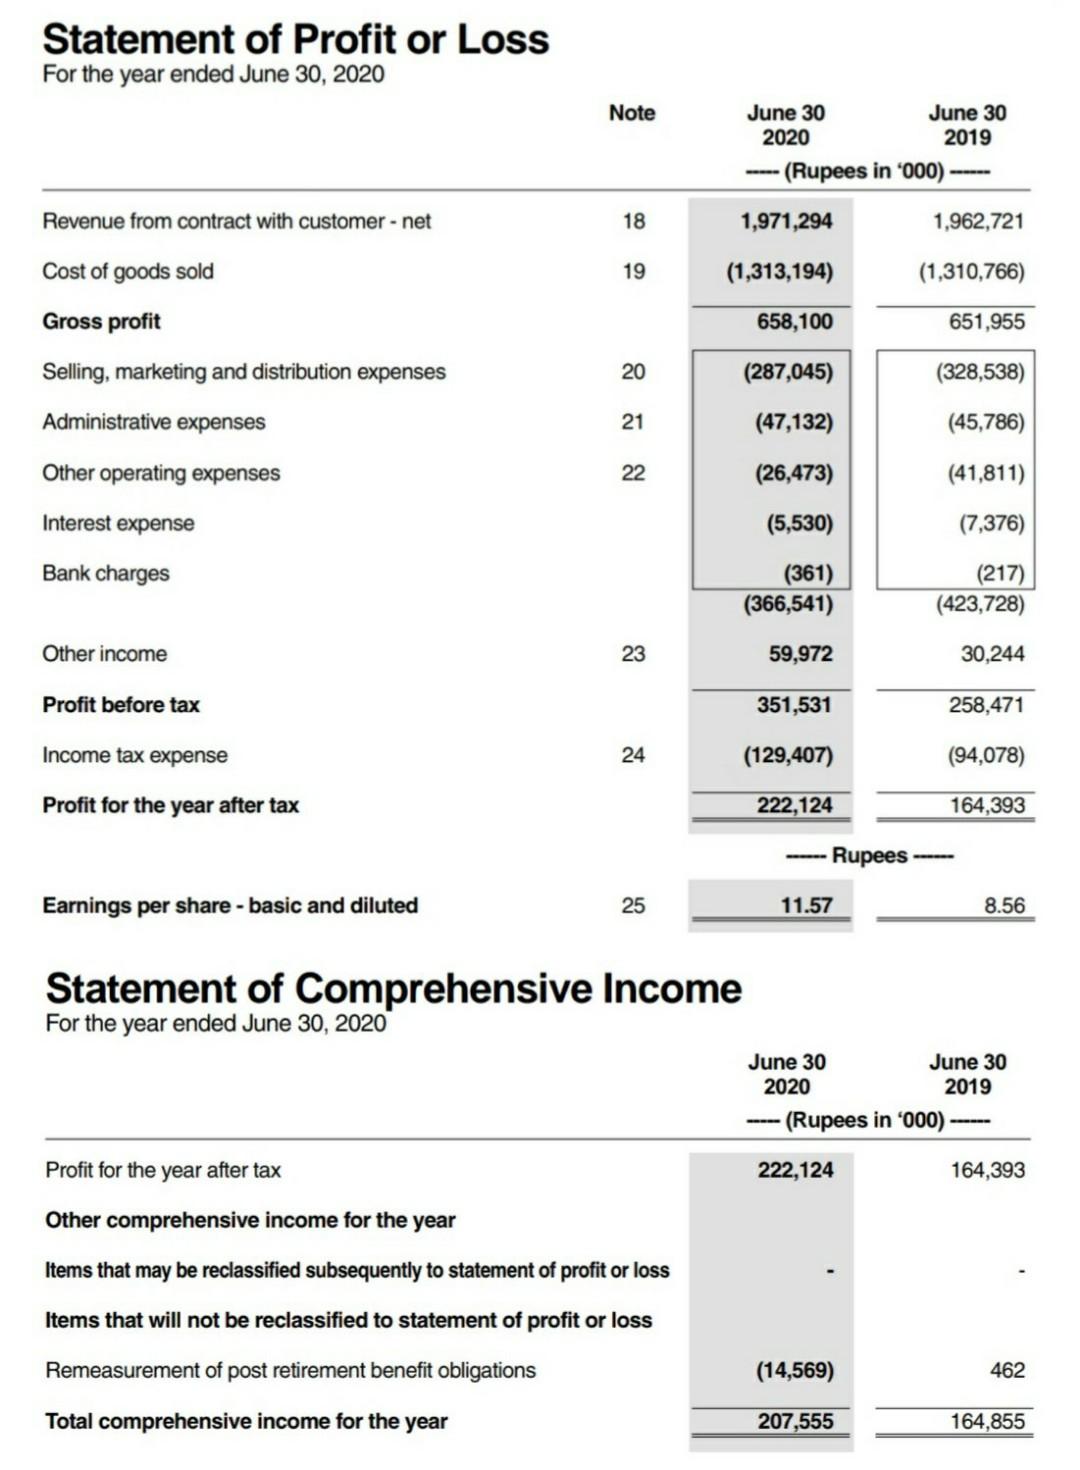
Statement of Financial Position As at June 30, 2020 Note June 30 2020 June 30 2019 --- (Rupees in '000) ASSETS Non-current asset Right-of-use asset Long-term deposits 5 6 32,644 215 32,859 616 616 Current assets 7 8 Stock-in-trade Trade debts Trade deposits Other receivables and prepayment Other financial assets Sales tax refundable Taxation - net Bank balances 9 10 511,860 193,290 13,079 139,306 478,957 58,921 19,753 14,558 1,429,724 1,462,583 326,792 156,356 9,493 81,130 557,312 27,192 25,479 5,625 1,189,379 1,189,995 11 Total assets EQUITY AND LIABILITIES 200,000 200,000 Authorised capital 20,000,000 ordinary shares of Rs. 10/- each Issued, subscribed and paid-up capital Unappropriated profit 12 192,000 590,269 782,269 192,000 449,914 641,914 Non-current liabilities Lease liabilities Staff retirement benefit - gratuity scheme 13 14 25,781 20,316 46,097 11,572 11,572 Current liabilities Trade and other payables Contract liabilities Current portion of lease liabilities Unclaimed dividend 15 16 449,186 82,943 517,012 93,775 9,661 13,769 634,217 4,380 536,509 1,462,583 1,189,995 Total equity and liabilities Contingencies and commitments 17 Statement of Cash Flows For the year ended June 30, 2020 Note June 30 June 30 2020 2019 - (Rupees in '000) CASH FLOWS FROM OPERATING ACTIVITIES 27 Cash flows from operations Income taxes paid Interest paid Staff retirement benefits paid - net 64,629 (123,681) (5,530) 764,394 (88,160) (7,376) 25,693 14 Net cash (used in)/ generated from operating activities (64,582) 694,551 CASH FLOWS FROM INVESTING ACTIVITIES 27,593 Interest income received Proceeds from long term deposit Investment in other financial assets Net cash (used in)/ generated from investing activities 59,735 401 (260,000) (199,864) 27,593 CASH FLOWS FROM FINANCING ACTIVITIES Lease principal repayment Dividend paid (7,165) (57,811) (64,976) (329,422) (20,525) (20,525) 701,619 Net (decrease) / increase in cash and cash equivalents Cash and cash equivalents at the beginning of the year 557,937 (143,682) Cash and cash equivalents at the end of the year 26 228,515 557,937 Statement of Profit or Loss For the year ended June 30, 2020 Note June 30 June 30 2020 2019 --- (Rupees in '000) 1,971,294 1,962,721 18 19 (1,313,194) (1,310,766) Revenue from contract with customer - net Cost of goods sold Gross profit Selling, marketing and distribution expenses Administrative expenses 658,100 651,955 20 (287,045) (328,538) 21 (47,132) (45,786) Other operating expenses 22 (26,473) (41,811) Interest expense (5,530) (7,376) Bank charges (361) (366,541) (217) (423,728) Other income 23 59,972 30.244 351,531 258,471 Profit before tax Income tax expense Profit for the year after tax 24 (129,407) (94,078) 222,124 164,393 Rupees Earnings per share - basic and diluted 25 11.57 8.56 Statement of Comprehensive Income For the year ended June 30, 2020 June 30 June 30 2020 2019 --- (Rupees in 000) Profit for the year after tax 222,124 164,393 Other comprehensive income for the year Items that may be reclassified subsequently to statement of profit or loss Items that will not be reclassified to statement of profit or loss Remeasurement of post retirement benefit obligations (14,569) 462 Total comprehensive income for the year 207,555 164,855 Statement of Financial Position As at June 30, 2020 Note June 30 2020 June 30 2019 --- (Rupees in '000) ASSETS Non-current asset Right-of-use asset Long-term deposits 5 6 32,644 215 32,859 616 616 Current assets 7 8 Stock-in-trade Trade debts Trade deposits Other receivables and prepayment Other financial assets Sales tax refundable Taxation - net Bank balances 9 10 511,860 193,290 13,079 139,306 478,957 58,921 19,753 14,558 1,429,724 1,462,583 326,792 156,356 9,493 81,130 557,312 27,192 25,479 5,625 1,189,379 1,189,995 11 Total assets EQUITY AND LIABILITIES 200,000 200,000 Authorised capital 20,000,000 ordinary shares of Rs. 10/- each Issued, subscribed and paid-up capital Unappropriated profit 12 192,000 590,269 782,269 192,000 449,914 641,914 Non-current liabilities Lease liabilities Staff retirement benefit - gratuity scheme 13 14 25,781 20,316 46,097 11,572 11,572 Current liabilities Trade and other payables Contract liabilities Current portion of lease liabilities Unclaimed dividend 15 16 449,186 82,943 517,012 93,775 9,661 13,769 634,217 4,380 536,509 1,462,583 1,189,995 Total equity and liabilities Contingencies and commitments 17 Statement of Cash Flows For the year ended June 30, 2020 Note June 30 June 30 2020 2019 - (Rupees in '000) CASH FLOWS FROM OPERATING ACTIVITIES 27 Cash flows from operations Income taxes paid Interest paid Staff retirement benefits paid - net 64,629 (123,681) (5,530) 764,394 (88,160) (7,376) 25,693 14 Net cash (used in)/ generated from operating activities (64,582) 694,551 CASH FLOWS FROM INVESTING ACTIVITIES 27,593 Interest income received Proceeds from long term deposit Investment in other financial assets Net cash (used in)/ generated from investing activities 59,735 401 (260,000) (199,864) 27,593 CASH FLOWS FROM FINANCING ACTIVITIES Lease principal repayment Dividend paid (7,165) (57,811) (64,976) (329,422) (20,525) (20,525) 701,619 Net (decrease) / increase in cash and cash equivalents Cash and cash equivalents at the beginning of the year 557,937 (143,682) Cash and cash equivalents at the end of the year 26 228,515 557,937 Statement of Profit or Loss For the year ended June 30, 2020 Note June 30 June 30 2020 2019 --- (Rupees in '000) 1,971,294 1,962,721 18 19 (1,313,194) (1,310,766) Revenue from contract with customer - net Cost of goods sold Gross profit Selling, marketing and distribution expenses Administrative expenses 658,100 651,955 20 (287,045) (328,538) 21 (47,132) (45,786) Other operating expenses 22 (26,473) (41,811) Interest expense (5,530) (7,376) Bank charges (361) (366,541) (217) (423,728) Other income 23 59,972 30.244 351,531 258,471 Profit before tax Income tax expense Profit for the year after tax 24 (129,407) (94,078) 222,124 164,393 Rupees Earnings per share - basic and diluted 25 11.57 8.56 Statement of Comprehensive Income For the year ended June 30, 2020 June 30 June 30 2020 2019 --- (Rupees in 000) Profit for the year after tax 222,124 164,393 Other comprehensive income for the year Items that may be reclassified subsequently to statement of profit or loss Items that will not be reclassified to statement of profit or loss Remeasurement of post retirement benefit obligations (14,569) 462 Total comprehensive income for the year 207,555 164,855
Step by Step Solution
There are 3 Steps involved in it

Get step-by-step solutions from verified subject matter experts