

Question: Show all work 13. Data on IQ was collected for a group of 200 7th grade students in Utah County. Use the histogram to answer
Show all work
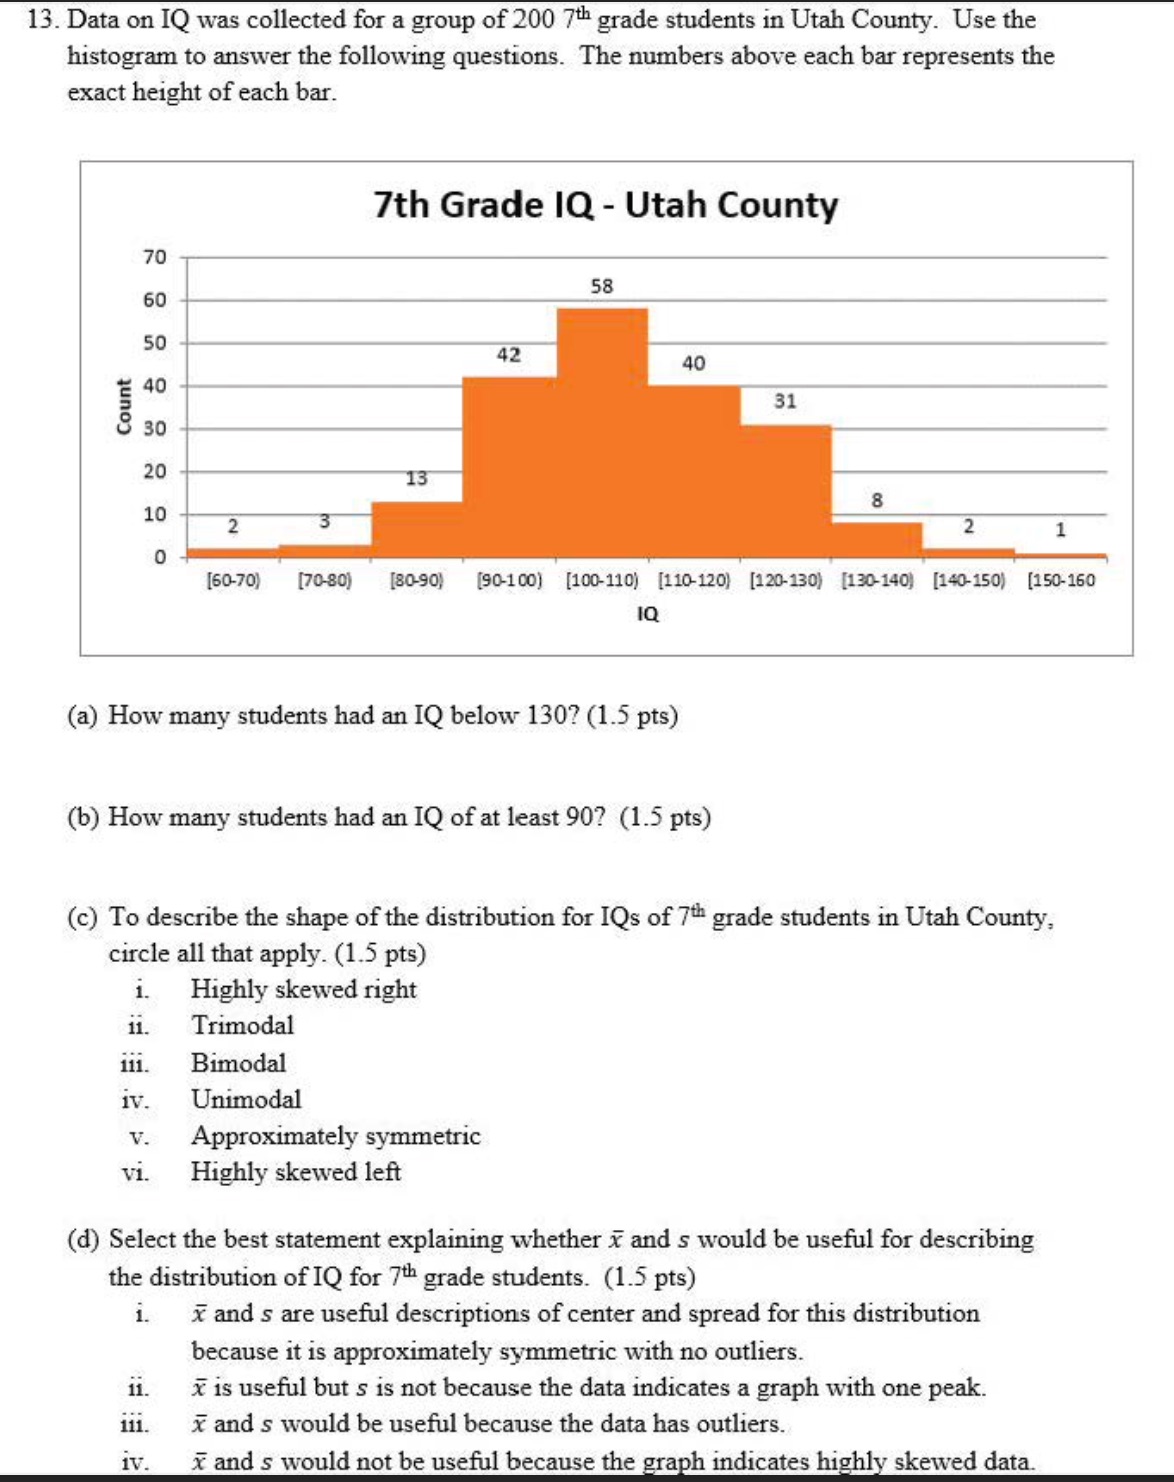
13. Data on IQ was collected for a group of 200 7th grade students in Utah County. Use the histogram to answer the following questions. The numbers above each bar represents the exact height of each bar. 7th Grade IQ - Utah County 70 60 58 50 42 40 40 31 Count 30 20 13 10 2 0 [60-70) [70-80) [80-90) [90-100) [100-110) [110-120) [120-130) [130-140) [140-150) [150-160 1Q (a) How many students had an IQ below 130? (1.5 pts) (b) How many students had an IQ of at least 90? (1.5 pts) (c) To describe the shape of the distribution for IQs of 7th grade students in Utah County, circle all that apply. (1.5 pts) 1 . Highly skewed right Trimodal iii. Bimodal iv . Unimodal V. Approximately symmetric vi. Highly skewed left (d) Select the best statement explaining whether x and s would be useful for describing the distribution of IQ for 7th grade students. (1.5 pts) 1. x and s are useful descriptions of center and spread for this distribution because it is approximately symmetric with no outliers. ii. x is useful but s is not because the data indicates a graph with one peak. iii. x and s would be useful because the data has outliers. 1V. x and s would not be useful because the graph indicates highly skewed data
Step by Step Solution
There are 3 Steps involved in it

Get step-by-step solutions from verified subject matter experts