

Question: Show all work for better understanding In-Class SHOW ALL WORK! date Round all answers to 3 decimal places unless directed otherwise. Use a graphing calculator
Show all work for better understanding
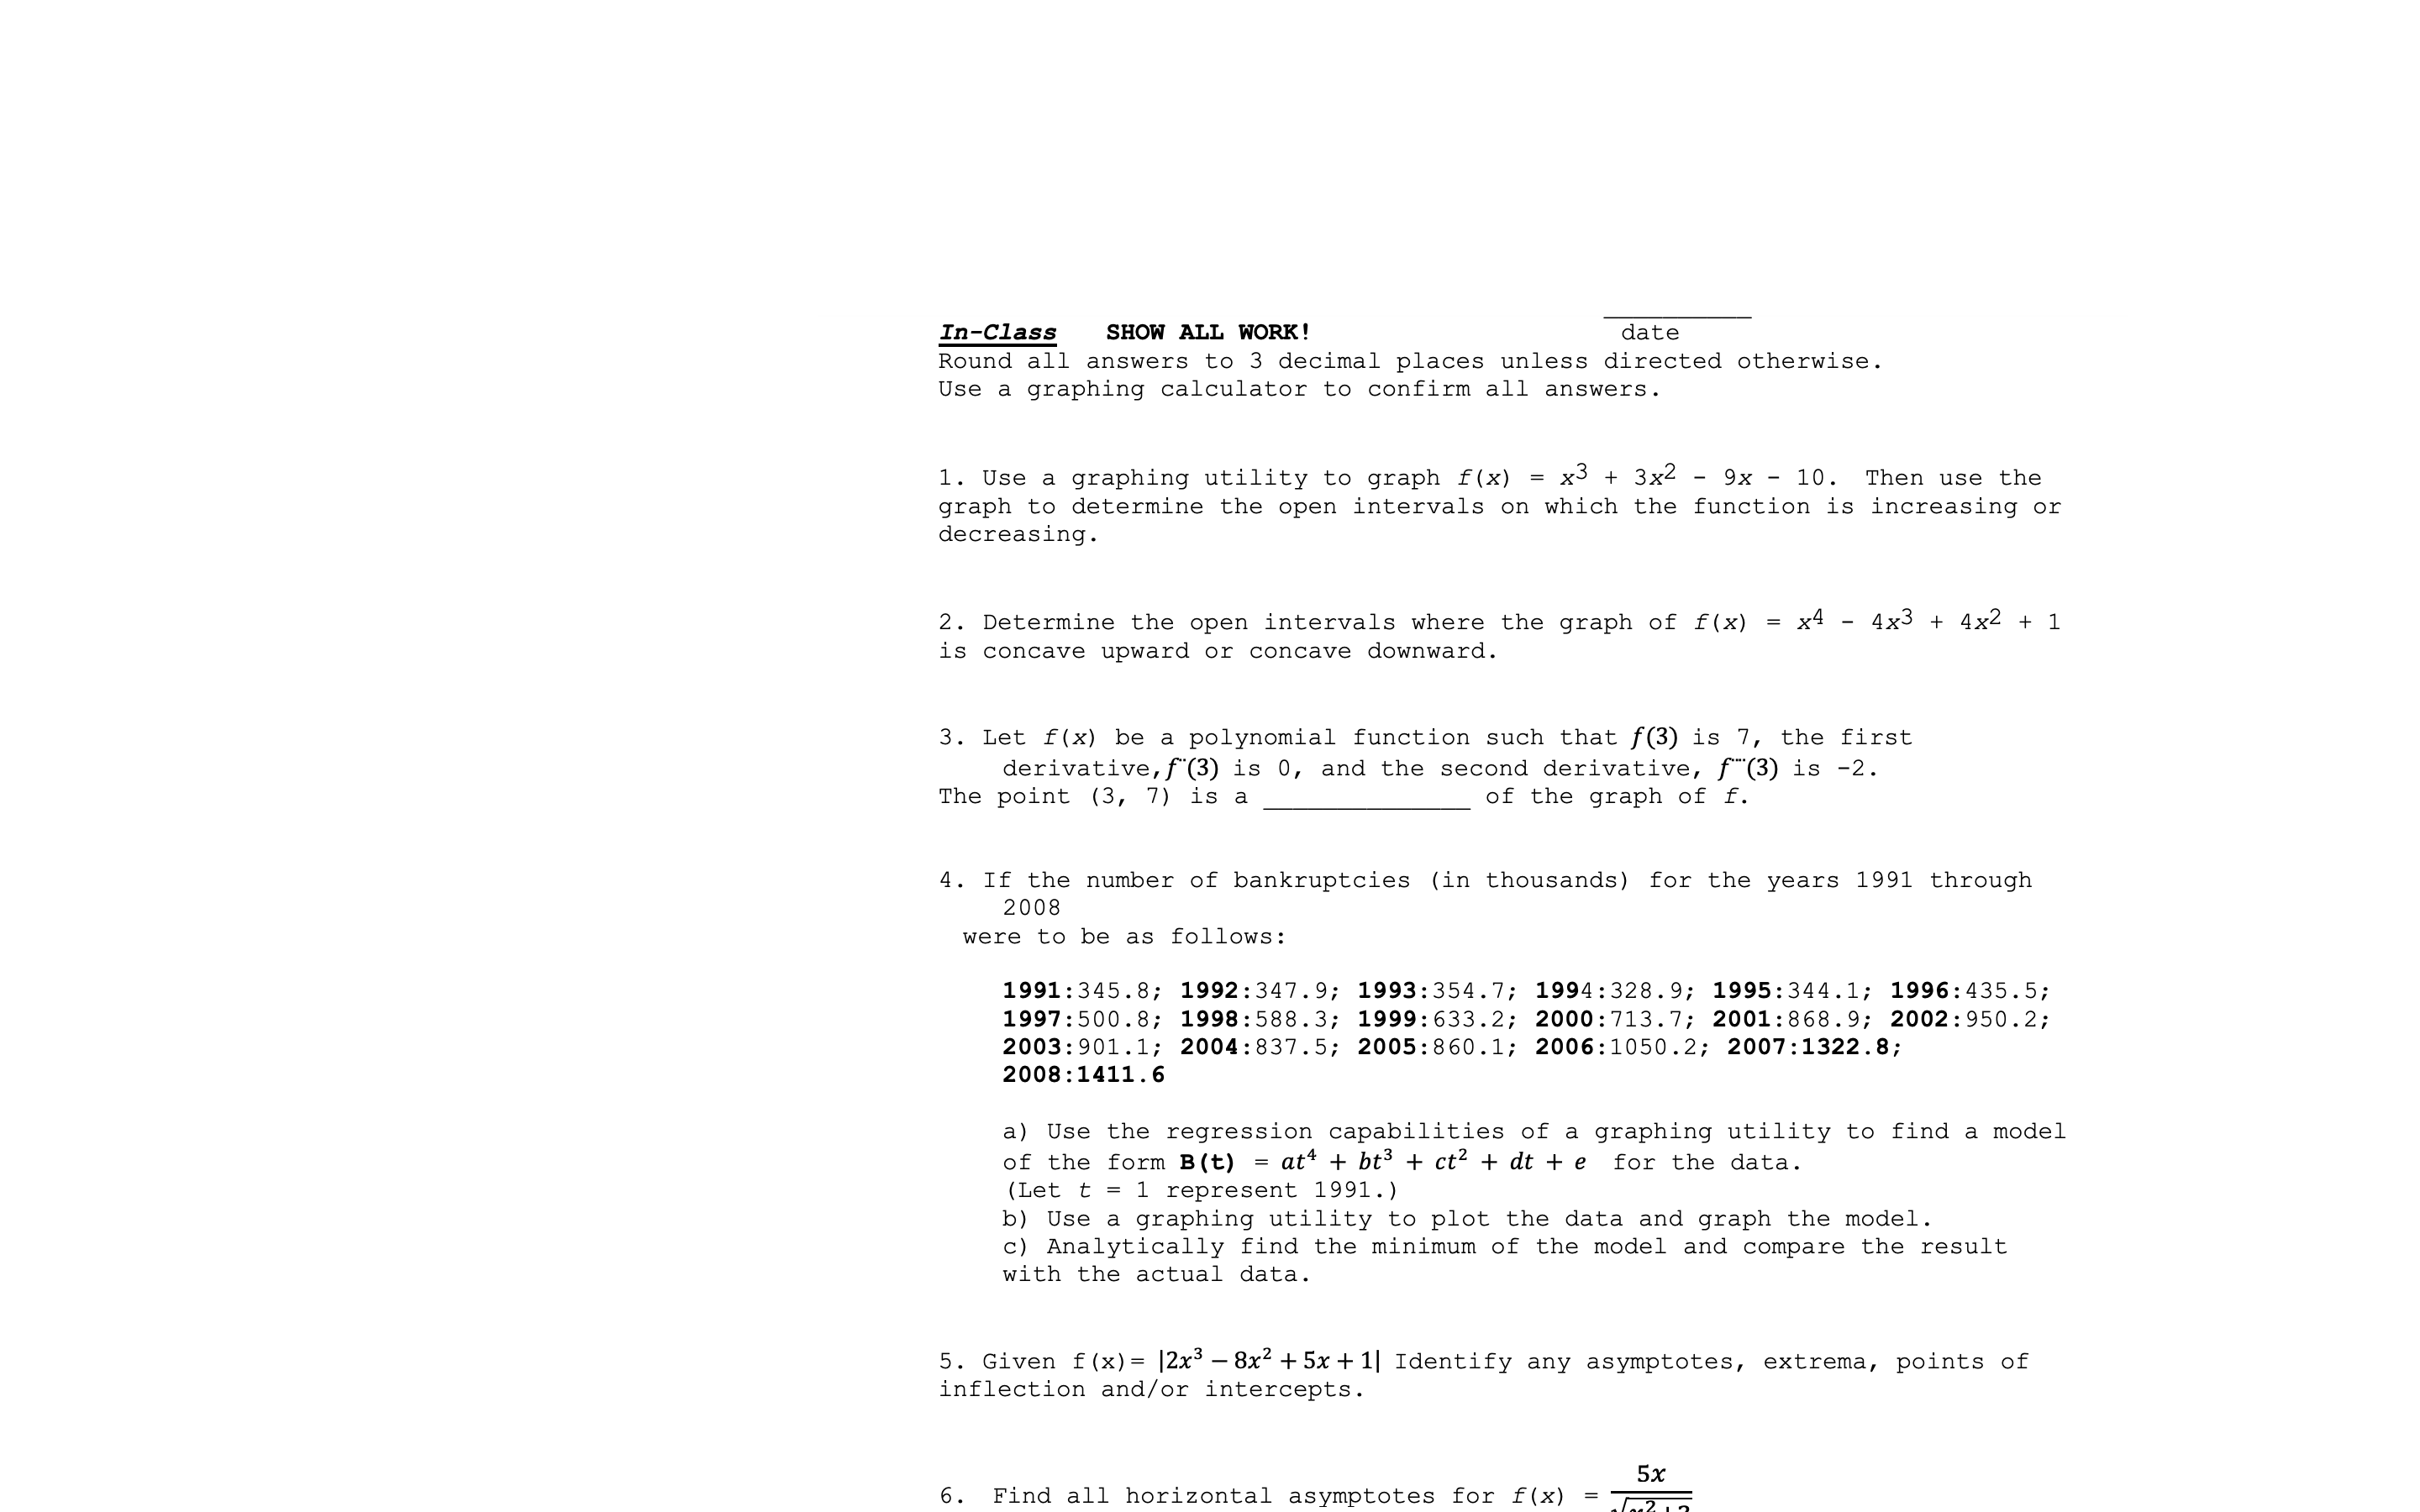
In-Class SHOW ALL WORK! date Round all answers to 3 decimal places unless directed otherwise. Use a graphing calculator to confirm all answers. 1. Use a graphing utility to graph f(x) = x3 + 3x2 - 9x - 10. Then use the graph to determine the open intervals on which the function is increasing or decreasing. 2. Determine the open intervals where the graph of f(x) = x4 - 4x3 + 4x2 + 1 is concave upward or concave downward. 3. Let f(x) be a polynomial function such that f(3) is 7, the first derivative, f'(3) is 0, and the second derivative, f"(3) is -2. The point (3, 7) is a of the graph of f 4. If the number of bankruptcies (in thousands) for the years 1991 through 2008 were to be as follows: 1991:345.8; 1992:347.9; 1993:354.7; 1994:328.9; 1995:344.1; 1996:435.5; 1997:500.8; 1998:588.3; 1999:633.2; 2000:713.7; 2001:868.9; 2002:950.2; 200 01.1; 2004:837.5; 2005:860.1; 2006:1050.2; 2007:1322.8; 2008:1411.6 a) Use the regression capabilities of a graphing utility to find a model of the form B(t) = at* + bt + ct? + dt + e for the data. (Let t = 1 represent 1991.) b) Use a graphing utility to plot the data and graph the model. c) Analytically find the minimum of the model and compare the result with the actual data. 5. Given f(x)= |2x 8x2+5x+ 1| Identify any asymptotes, extrema, points of inflection and/or intercepts. 5x 6. Find all horizontal asymptotes for f(x) = 5=
Step by Step Solution
There are 3 Steps involved in it

Get step-by-step solutions from verified subject matter experts