

Question: Show all work please Question 1 1. The test scores of 40 students are listed below. 25 35 43 44 47 48 54 55 56
Show all work please
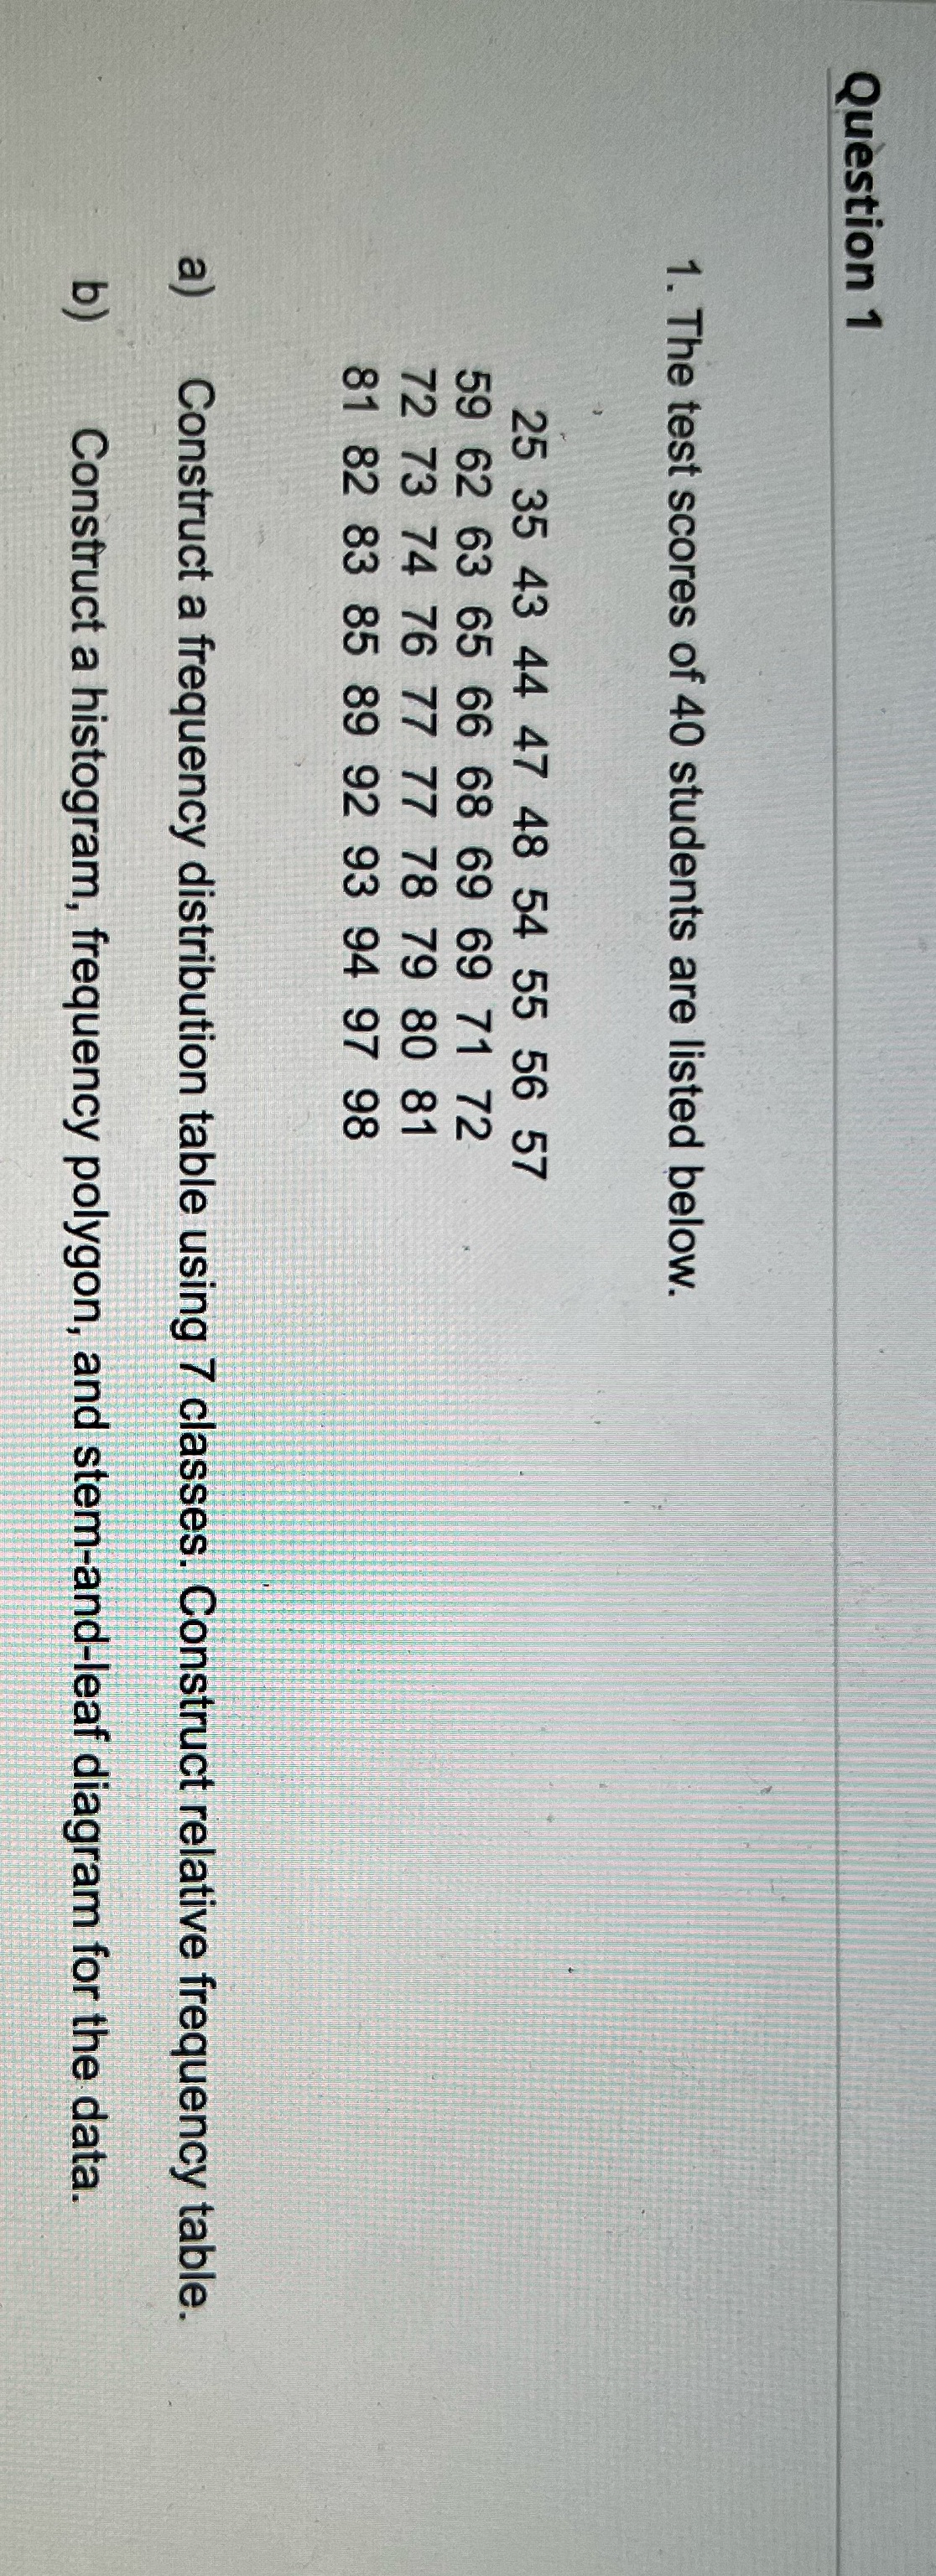
Question 1 1. The test scores of 40 students are listed below. 25 35 43 44 47 48 54 55 56 57 59 62 63 65 66 68 69 69 71 72 72 73 74 76 77 77 78 79 80 81 81 82 83 85 89 92 93 94 97 98 Construct a frequency distribution table using 7 classes. Construct relative frequency table. Construct a histogram, frequency polygon, and stem-and-leaf diagram for the data
Step by Step Solution
There are 3 Steps involved in it
1 Expert Approved Answer
Step: 1 Unlock

Question Has Been Solved by an Expert!
Get step-by-step solutions from verified subject matter experts
Step: 2 Unlock
Step: 3 Unlock