

Question: show all work SECTION B: SHORT ANSWER QUESTIONS (5 MARKS) 1. The table below shows the data of one country in 2019 and 2020: Year
show all work
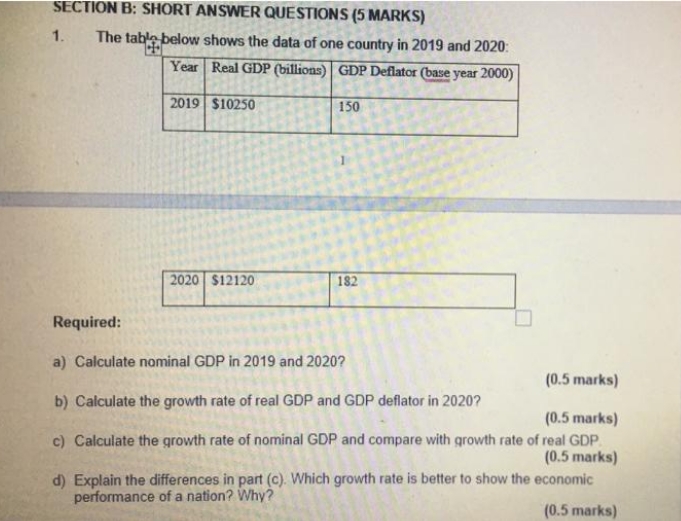
SECTION B: SHORT ANSWER QUESTIONS (5 MARKS) 1. The table below shows the data of one country in 2019 and 2020: Year | Real GDP (billions) | GDP Deflator (base year 2000) 2019 | $10250 150 2020 $12120 182 Required: a) Calculate nominal GDP in 2019 and 2020? (0.5 marks) b) Calculate the growth rate of real GDP and GDP deflator in 2020? (0.5 marks) c) Calculate the growth rate of nominal GDP and compare with growth rate of real GDP (0.5 marks) d) Explain the differences in part (c). Which growth rate is better to show the economic performance of a nation? Why? (0.5 marks)
Step by Step Solution
There are 3 Steps involved in it
1 Expert Approved Answer
Step: 1 Unlock

Question Has Been Solved by an Expert!
Get step-by-step solutions from verified subject matter experts
Step: 2 Unlock
Step: 3 Unlock