

Question: show all work. The chart below shows the relation between number of stocks in portfolio and average annual standard deviation. Please explain what we can
show all work.
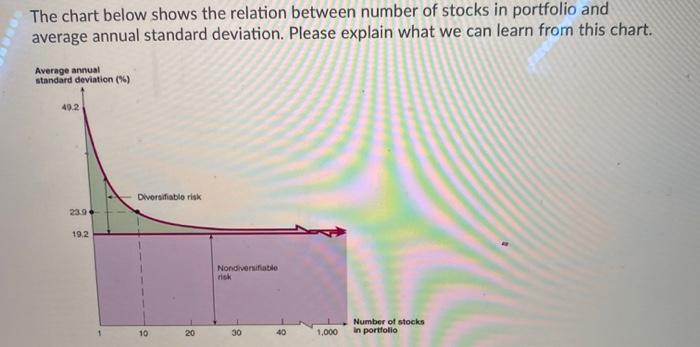
The chart below shows the relation between number of stocks in portfolio and average annual standard deviation. Please explain what we can learn from this chart Average annual standard deviation (%) 40.2 Diversifiablo risk 23.9. 19.2 Nondiversifiable 10 Number of stocks In portfolio 20 30 20 1,000
Step by Step Solution
There are 3 Steps involved in it
1 Expert Approved Answer
Step: 1 Unlock

Question Has Been Solved by an Expert!
Get step-by-step solutions from verified subject matter experts
Step: 2 Unlock
Step: 3 Unlock