

Question: Show all work with no excel 19,20,21, and 22 Chapter 1.3 USE THE INFORMATION BELOw FOR THE PROBLEMS15-25 Assume that you are an analyst for
Show all work with no excel
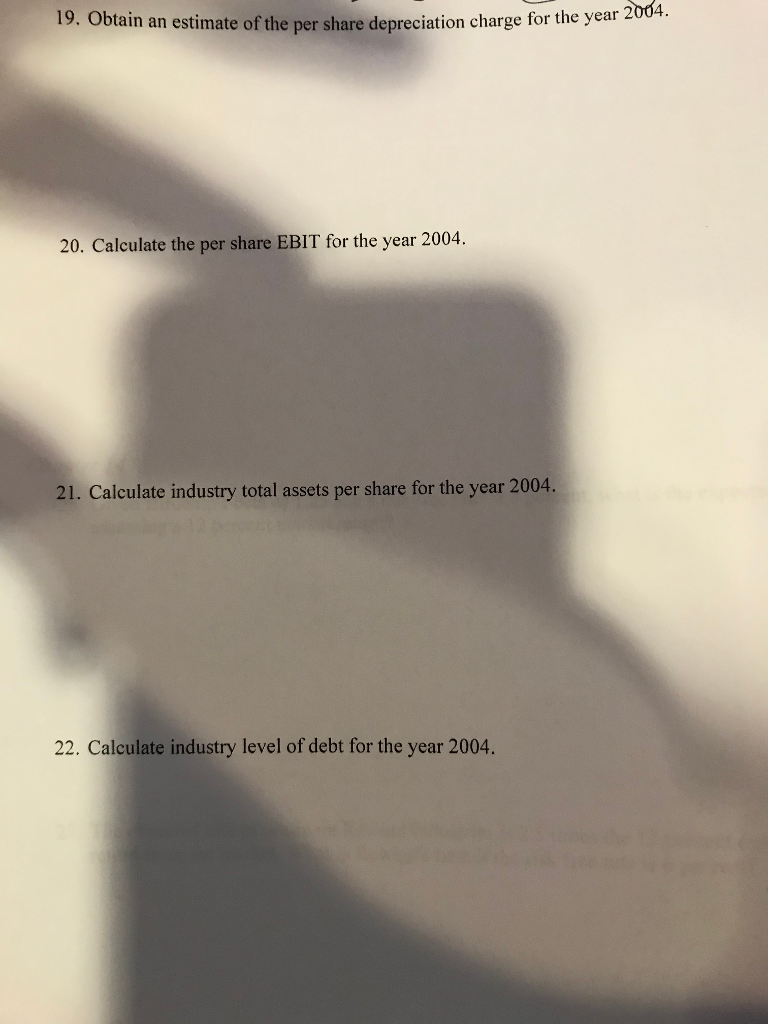
19,20,21, and 22
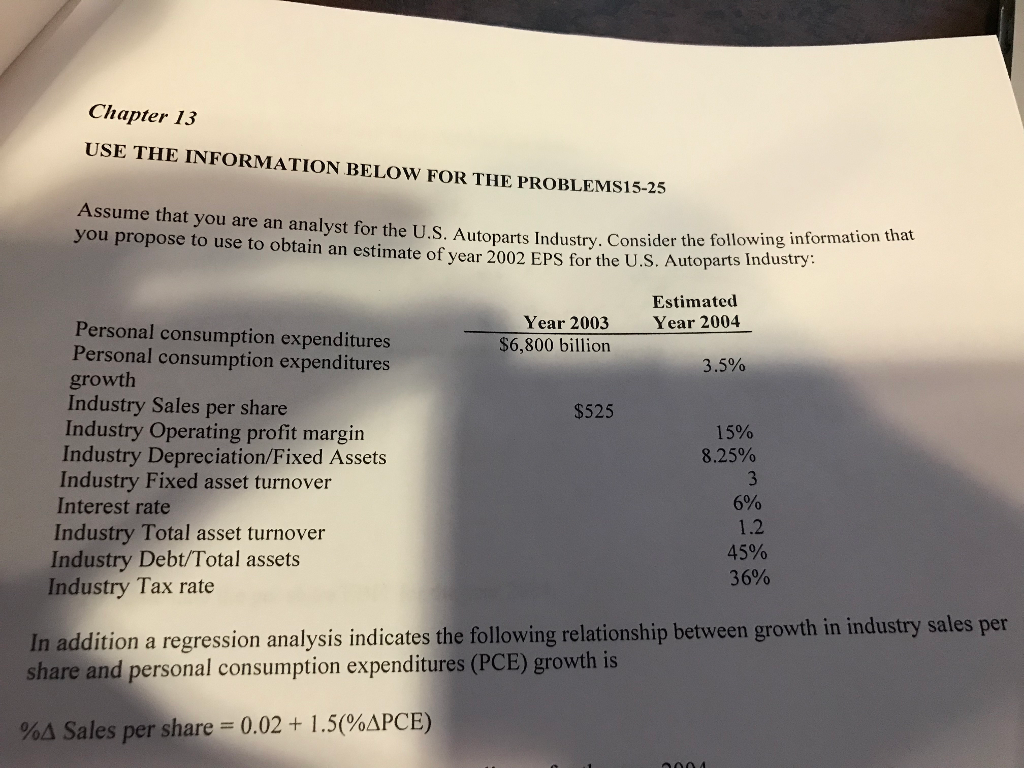
Chapter 1.3 USE THE INFORMATION BELOw FOR THE PROBLEMS15-25 Assume that you are an analyst for the U.S. Autoparts Industry. Consider the following ito you propose to use to obtain an estimate of year 2002 EPS for the U.S. Autoparts Industr Estimated ear 2003Year 2004 Personal consumption expenditures $6,800 billion Personal consumption expenditures 3.5% growth Industry Sales per share Industry Operating profit margin Industry Depreciation/Fixed Assets Industry Fixed asset turnover Interest rate Industry Total asset turnover Industry Debt/Total assets $525 15% 8.25% 6% 1.2 36% Industry Tax rate In addition a regression analysis indicates the following relationship between growth in industry sales per share and personal consumption expenditures (PCE) growth is %? Sales per share = 0.02 + 1.51%ACE)
Step by Step Solution
There are 3 Steps involved in it

Get step-by-step solutions from verified subject matter experts