

Question: show all working Factors for Calculating Three-Sigma Limits for the Chart and R-Chart Factor for UCL and Factor for Factor for Size of LCL for
show all working 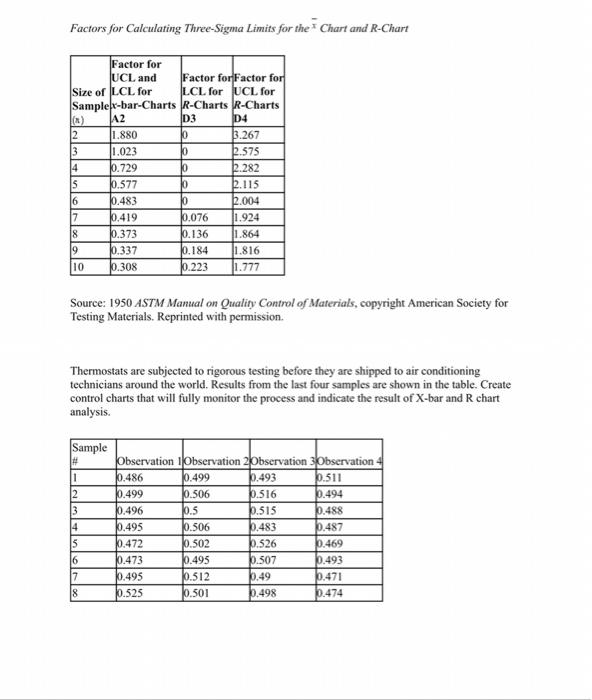
Factors for Calculating Three-Sigma Limits for the Chart and R-Chart Factor for UCL and Factor for Factor for Size of LCL for LCL for UCL for Samplex-bar-Charts R-Charts R-Charts (*) A2 D3 D4 12 1.880 10 5.267 3 1.023 10 1.575 14 10.729 10 1.282 S 0.577 10 1.115 16 0.483 b 1.004 7 10.419 0.076 1.924 18 0.373 10.136 1.864 19 0.337 0.184 11.816 10 10.308 10.223 1.777 Source: 1950 ASTM Manual on Quality Control of Materials, copyright American Society for Testing Materials. Reprinted with permission. Thermostats are subjected to rigorous testing before they are shipped to air conditioning technicians around the world. Results from the last four samples are shown in the table. Create control charts that will fully monitor the process and indicate the result of X-bar and R chart analysis. Sample # Observation 1 Observation 2 Observation 3Observation 4 1 10.486 0.499 0.493 0.511 2 10.499 10.506 0.516 0.494 3 10.496 0.5 9.515 0.488 14 0.495 0.506 0.483 0.487 s 0.472 10.502 1.526 0.469 16 0.473 0.495 0.507 0.493 7 10.495 10.512 6.49 0.471 8 0.525 0.501 0.498 0.474
Step by Step Solution
There are 3 Steps involved in it
1 Expert Approved Answer
Step: 1 Unlock

Question Has Been Solved by an Expert!
Get step-by-step solutions from verified subject matter experts
Step: 2 Unlock
Step: 3 Unlock