

Question: Show all your work using Excel functions - Attach your Excel outputs. Television viewing reached a new high when the Nielsen Company reported a mean
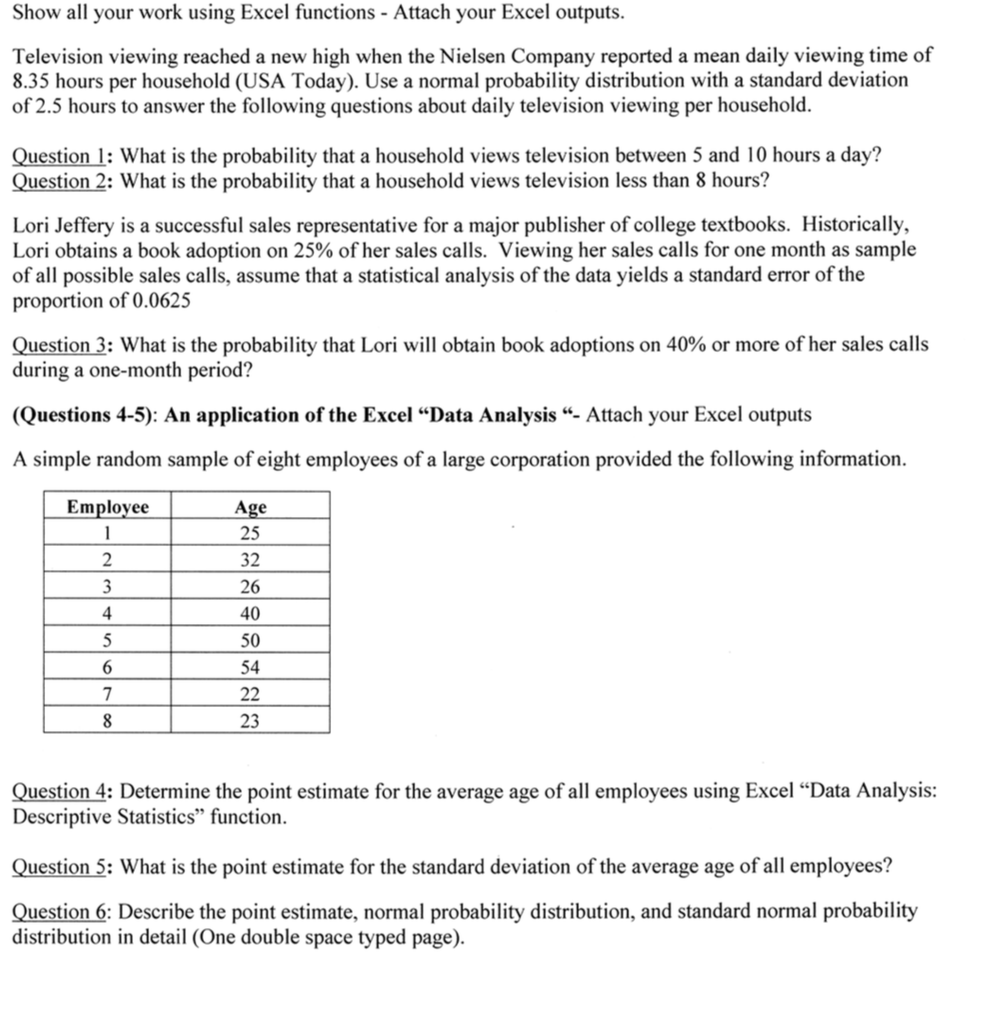
Show all your work using Excel functions - Attach your Excel outputs. Television viewing reached a new high when the Nielsen Company reported a mean daily viewing time of 8.35 hours per household (USA Today). Use a normal probability distribution with a standard deviation of 2.5 hours to answer the following questions about daily television viewing per household. Qggstign I: What is the probability that a household views television between 5 and 10 hours a day? ngstign : What is the probability that a household views television less than 8 hours? Lori Jeffery is a successful sales representative for a major publisher of college textbooks. Historically, Lori obtains a book adoption on 25% of her sales calls. Viewing her sales calls for one month as sample of all possible sales calls, assume that a statistical analysis of the data yields a standard error of the proportion of 0.0625 Questign :1: What is the probability that Lori will obtain book adoptions on 40% or more of her sales calls during a one-month period? (Questions 4-5): An application of the Excel \"Data Analysis \"- Attach your Excel outputs A simple random sample of eight employees of a large corporation provided the following information. Question : Determine the point estimate for the average age of all employees using Excel \"Data Analysis: Descriptive Statistics\" function. Question 5: What is the point estimate for the standard deviation of the average age of all employees? Question 6: Describe the point estimate, normal probability distribution, and standard normal probability distribution in detail (One double space typed page)
Step by Step Solution
There are 3 Steps involved in it

Get step-by-step solutions from verified subject matter experts