

Question: show answer with work please Problem 3. (18 points) The following data were collected for 12 months using a company's sales reports. The report shows,
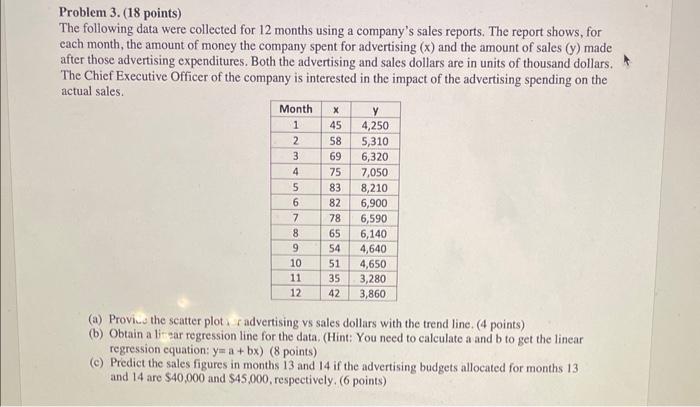
Problem 3. (18 points) The following data were collected for 12 months using a company's sales reports. The report shows, for each month, the amount of money the company spent for advertising (x) and the amount of sales (y) made after those advertising expenditures. Both the advertising and sales dollars are in units of thousand dollars. The Chief Executive Officer of the company is interested in the impact of the advertising spending on the actual sales. (a) Provicu the seatter plot, i advertising vs sales dollars with the trend line, (4 points) (b) Obtain a lit sar regression line for the data. (Hint: You need to calculate a and b to get the linear regression equation: y=a+bx)(8 points ) (c) Predict the sales figures in months 13 and 14 if the advertising budgets allocated for months 13 and 14 are $40,000 and $45,000, respectively. (6 points)
Step by Step Solution
There are 3 Steps involved in it

Get step-by-step solutions from verified subject matter experts