

Question: show formulas in excel 4. The quality controller at a local hospital has collected data on the proportion of rework in the lab (based on
show formulas in excel 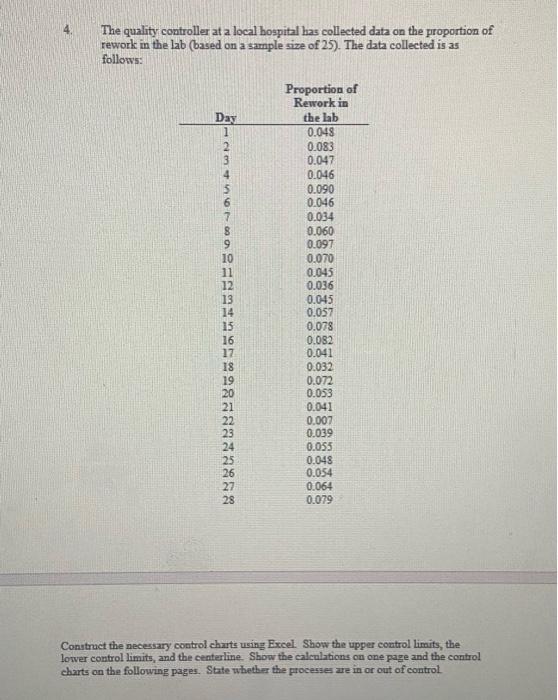
4. The quality controller at a local hospital has collected data on the proportion of rework in the lab (based on a sample size of 25 ). The data collected is as follows: Conutruct the necessary control charts using Excel. Show the upper coutrol limits, the lower control limits, and the centerline. Show the calculations ou one page and the control charts on the following pager. State whether the processes are in or out of control
Step by Step Solution
There are 3 Steps involved in it
1 Expert Approved Answer
Step: 1 Unlock

Question Has Been Solved by an Expert!
Get step-by-step solutions from verified subject matter experts
Step: 2 Unlock
Step: 3 Unlock