

Question: Show formulas used in Excel for better understanding .. Consider two alternative designs, A and B, for an investment opportunity. Suppose there is uncertainty concerning
Show formulas used in Excel for better understanding ..
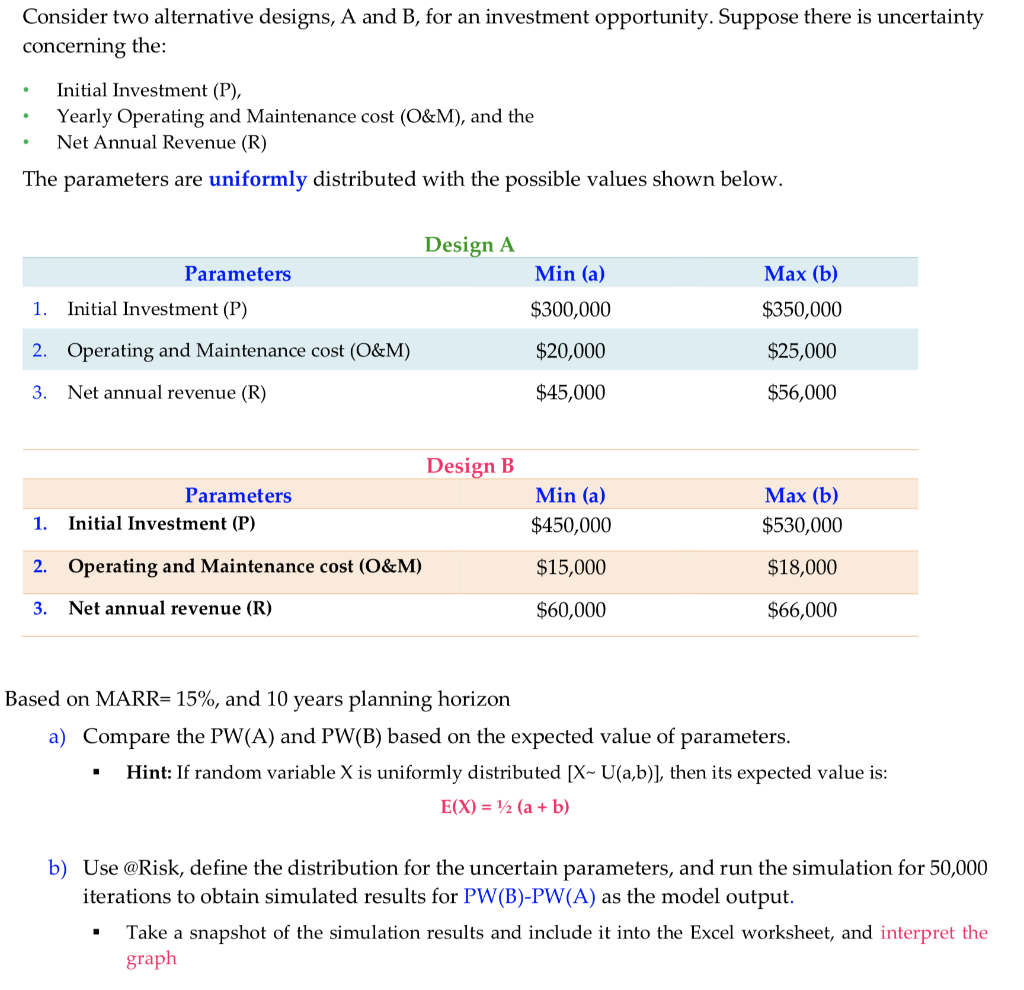
Consider two alternative designs, A and B, for an investment opportunity. Suppose there is uncertainty concerning the: Initial Investment (P), Yearly Operating and Maintenance cost (O&M), and the Net Annual Revenue (R) The parameters are uniformly distributed with the possible values shown below. Design A Min (a) $300,000 $20,000 $45,000 Parameters Max (b) $350,000 $25,000 $56,000 1. 2. 3. Initial Investment (P) Operating and Maintenance cost (O&M) Net annual revenue (R) Design B Min (a) $450,000 $15,000 $60,000 Parameters Max (b) $530,000 $18,000 $66,000 1. 2. 3. Initial Investment (P) Operating and Maintenance cost (O&M) Net annual revenue (R) Based on MARR-15%, and 10 years planning horizon a) Compare the PW(A) and PW(B) based on the expected value of parameters * Hint: If random variable X is uniformly distributed [X- U(a,b)], then its expected value is b) Use @Risk, define the distribution for the uncertain parameters, and run the simulation for 50,000 iterations to obtain simulated results for PW(B)-PW(A) as the model output. * Take a snapshot of the simulation results and include it into the Excel worksheet, and interpret the graph Consider two alternative designs, A and B, for an investment opportunity. Suppose there is uncertainty concerning the: Initial Investment (P), Yearly Operating and Maintenance cost (O&M), and the Net Annual Revenue (R) The parameters are uniformly distributed with the possible values shown below. Design A Min (a) $300,000 $20,000 $45,000 Parameters Max (b) $350,000 $25,000 $56,000 1. 2. 3. Initial Investment (P) Operating and Maintenance cost (O&M) Net annual revenue (R) Design B Min (a) $450,000 $15,000 $60,000 Parameters Max (b) $530,000 $18,000 $66,000 1. 2. 3. Initial Investment (P) Operating and Maintenance cost (O&M) Net annual revenue (R) Based on MARR-15%, and 10 years planning horizon a) Compare the PW(A) and PW(B) based on the expected value of parameters * Hint: If random variable X is uniformly distributed [X- U(a,b)], then its expected value is b) Use @Risk, define the distribution for the uncertain parameters, and run the simulation for 50,000 iterations to obtain simulated results for PW(B)-PW(A) as the model output. * Take a snapshot of the simulation results and include it into the Excel worksheet, and interpret the graph
Step by Step Solution
There are 3 Steps involved in it

Get step-by-step solutions from verified subject matter experts