

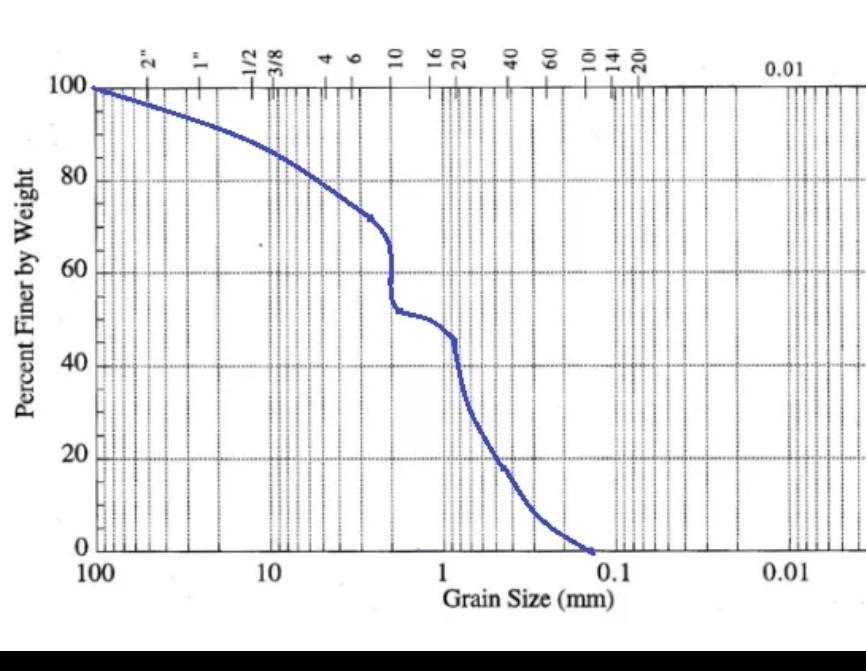
Question: show graph and explain graph and show that the graph extend to y axix @100 percent example : you can use excell much better thankyou.
show graph and explain graph
and show that the graph extend to y axix @100 percent example : you can use excell much better thankyou.
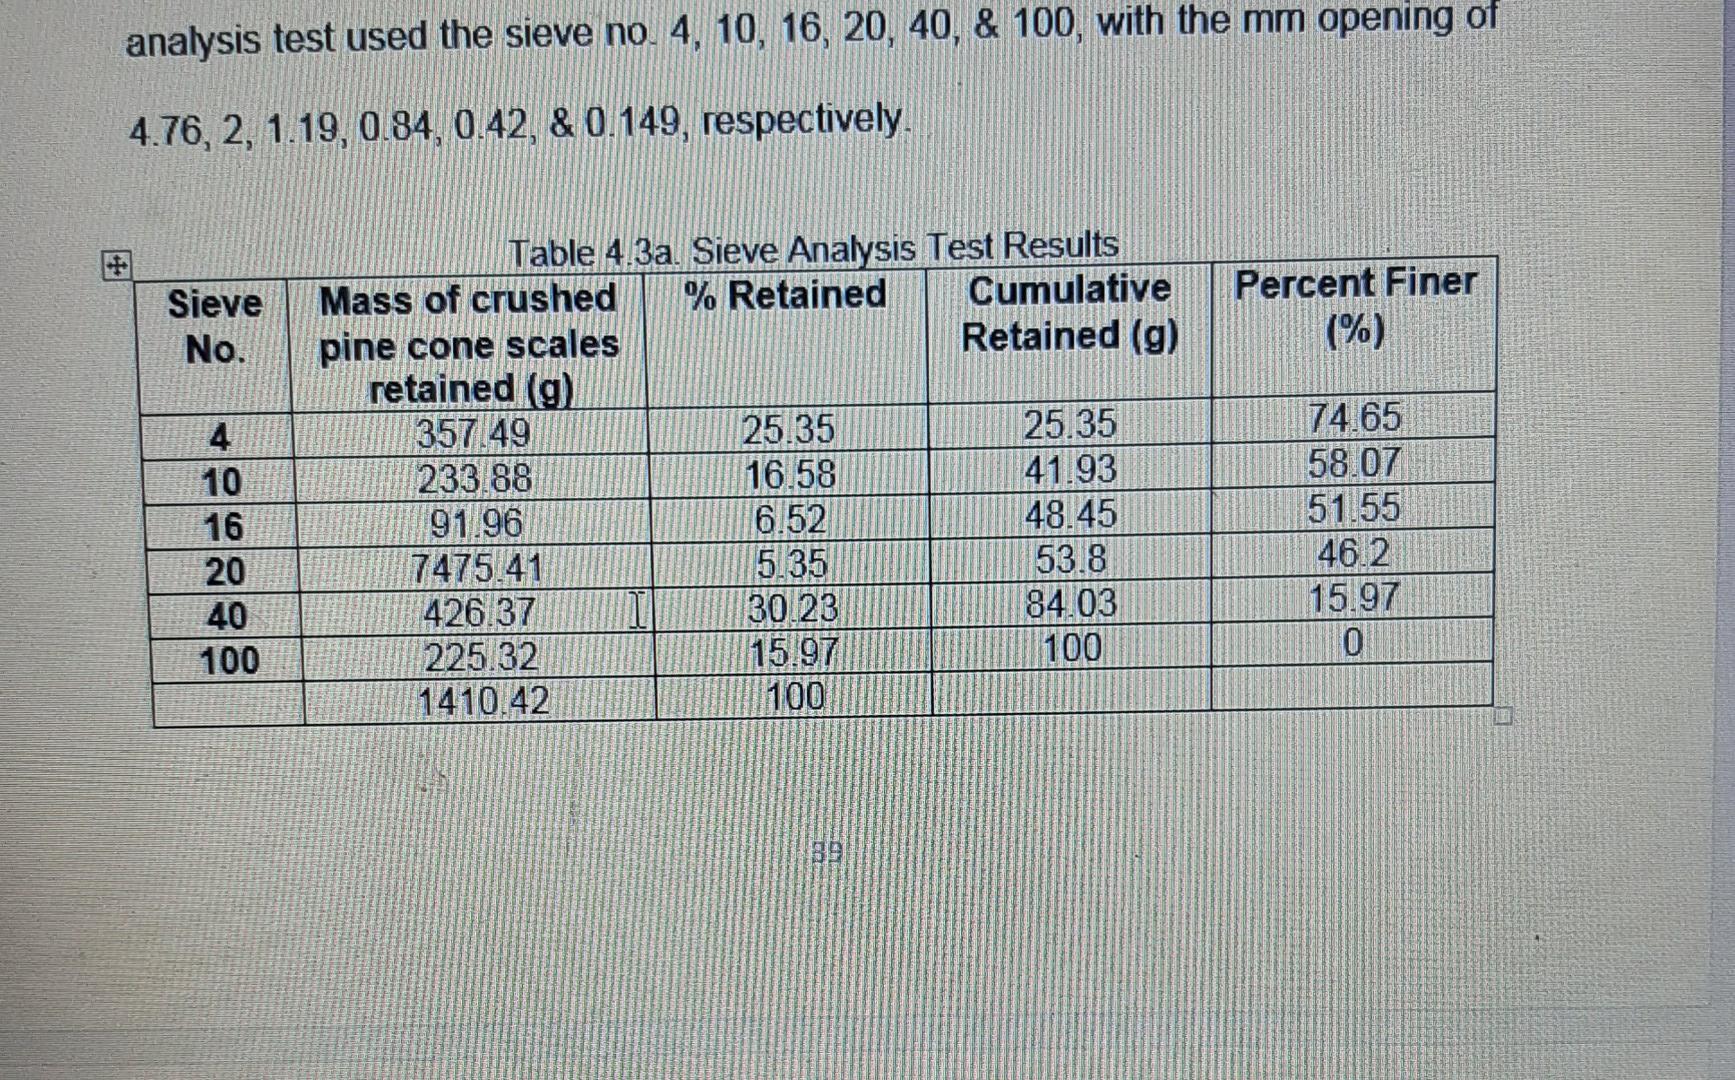
analysis test used the sieve no. 4, 10, 16, 20, 40, & 100, with the mm opening of 4.76, 2, 1.19, 0.84, 0.42, & 0.149, respectively. Sieve No. 4 10 16 20 40 100 Table 4.3a. Sieve Analysis Test Results Mass of crushed % Retained Cumulative Retained (g) pine cone scales retained (g) 357.49 233 88 91.96 7475.41 426.37 225.32 1410.42 25.35 16.58 6.52 5.35 30.23 15.97 100 25.35 41.93 48.45 53.8 84.03 100 Percent Finer (%) 74.65 58.07 51.55 46.2 15.97 0
Step by Step Solution
3.57 Rating (164 Votes )
There are 3 Steps involved in it
We show the graph to y anix 100 percent perant Fines Massx R... View full answer

Get step-by-step solutions from verified subject matter experts