

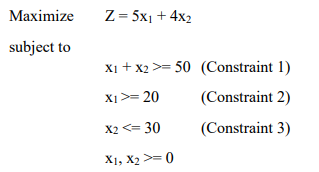
Question: Show graphically why the following LP model can not be solved for an optimal solution. Use the objective function line method to demonstrate. MAKE SURE
Show graphically why the following LP model can not be solved for an optimal solution. Use the objective function line method to demonstrate.
MAKE SURE TO GRAPH BY HAND and make sure u show all your work on the graph and explain. Also provide a managerial statement to expain the answer
Step by Step Solution
There are 3 Steps involved in it
1 Expert Approved Answer
Step: 1 Unlock

Question Has Been Solved by an Expert!
Get step-by-step solutions from verified subject matter experts
Step: 2 Unlock
Step: 3 Unlock