

Question: show how to do a step by step in excell An insurance compary is interested in determining whether life insurance covernge is influenced linearly by
show how to do a step by step in excell
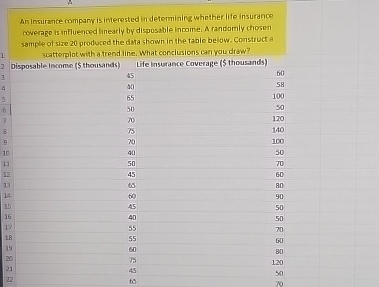
An insurance compary is interested in determining whether life insurance covernge is influenced linearly by dispusable income; A randamily chosen sample of size producod the data shown in the table below. Construct a seatterplat with a trend line. What conclusions can yau draw?
Disposablelncome $ thousands Life Insurance Coverage $ thousands
table
Step by Step Solution
There are 3 Steps involved in it
1 Expert Approved Answer
Step: 1 Unlock

Question Has Been Solved by an Expert!
Get step-by-step solutions from verified subject matter experts
Step: 2 Unlock
Step: 3 Unlock