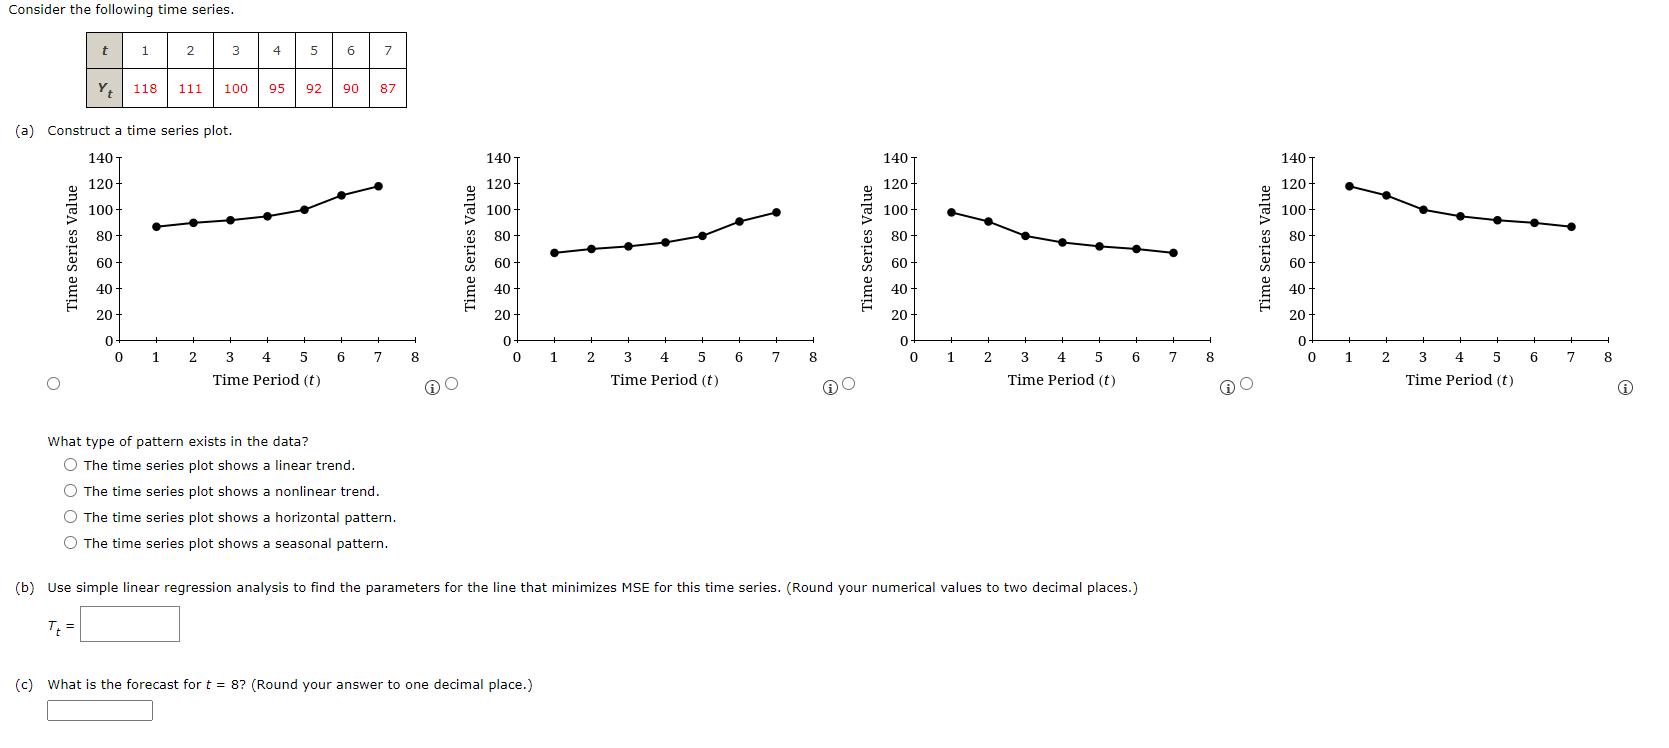
Question: Show how to do in excel please Consider the following time series. t 1 2 3 7 Y 118 111 100 95 92 90 87

Show how to do in excel please Consider theShow how to do in excel please

Consider the following time series. t 1 2 3 7 Y 118 111 100 95 92 90 87 (a) Construct a time series plot. 140 140 140 140 120 120 120 120 100 100 100+ 100- 80 80 80 80+ Time Series Value 60 60 60 60 40 40 40 40 20 20 20 20 + + + + + + + + H 0 + + + + 0 + + + + + + + 0 0 0 + 0 1 + 1 1 2 2 3 4 5 6 7 8 2 6 7 8 0 2 3 4 5 6 7 8 0 1 2 3 4 5 + + 3 4 5 Time Period (t) 6 7 8 O Time Period (t) 00 Time Period (t) a Time Period (t) i What type of pattern exists in the data? The time series plot shows a linear trend. The time series plot shows a nonlinear trend. The time series plot shows a horizontal pattern. The time series plot shows a seasonal pattern. (b) Use simple linear regression analysis to find the parameters for the line that minimizes MSE for this time series. (Round your numerical values to two decimal places.) T = = (c) What is the forecast for t = 8? (Round your answer to one decimal place.)

Step by Step Solution

There are 3 Steps involved in it

1 Expert Approved Answer
Step: 1 Unlock blur-text-image
Question Has Been Solved by an Expert!

Get step-by-step solutions from verified subject matter experts

Step: 2 Unlock
Step: 3 Unlock

Students Have Also Explored These Related General Management Questions!