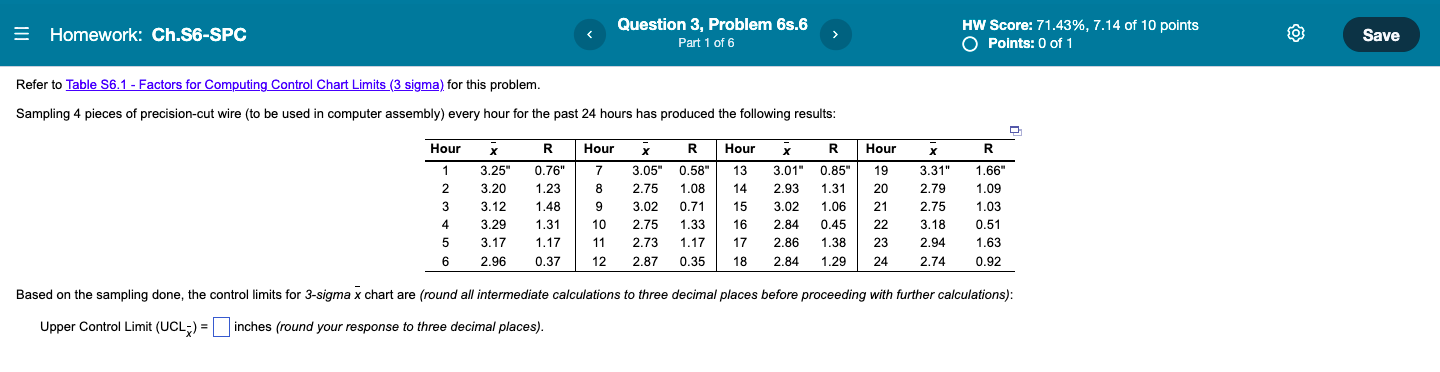
Question: Show how to solve step by step = Homework: Ch.S6-SPC Question 3, Problem 6s.6 Part 1 of 6 > HW Score: 71.43%, 7.14 of 10

Show how to solve step by step = Homework:Show how to solve step by step = Homework:Show how to solve step by step

= Homework: Ch.S6-SPC Question 3, Problem 6s.6 Part 1 of 6 > HW Score: 71.43%, 7.14 of 10 points O Points: 0 of 1 Save Refer to Table 56.1 - Factors for Computing Control Chart Limits (3 sigma) for this problem. Sampling 4 pieces of precision-cut wire (to be used in computer assembly) every hour for the past 24 hours has produced the following results: Hour Hour R Hour R 1 7 8 2 3 4 4 5 6 x 3.25" 3.20 3.12 3.29 3.17 2.96 R 0.76" 1.23 1.48 1.31 1.17 0.37 9 10 11 12 X R 3.05" 0.58" 2.75 1.08 3.02 0.71 2.75 1.33 2.73 1.17 2.87 0.35 Hour 13 14 15 16 17 18 3.01" 2.93 3.02 2.84 2.86 2.84 0.85" 1.31 1.06 0.45 1.38 1.29 19 20 21 22 23 24 3.31" 2.79 2.75 3.18 2.94 2.74 1.66" 1.09 1.03 0.51 1.63 0.92 Based on the sampling done, the control limits for 3-sigma x chart are (round all intermediate calculations to three decimal places before proceeding with further calculations): Upper Control Limit (UCL;) - inches (round your response to three decimal places). = Homework: Ch.56-SPC Question 4, Problem 6s.8 Part 1 of 5 1 HW Score: 71.43%, 7.14 of 10 points O Points: 0 of 1 : Save A. Choudhury's bowling ball factory in Illinois makes bowling balls of adult size and weight only. The standard deviation in the weight of a bowling ball produced at the factory is known to be 0.24 pounds. Each day for 24 days, the average weight, in pounds, of 9 of the bowling balls produced that day has been assessed as follows: Day Day Day Average (lb.) 1 2 3 4 Average (ib.) 10.3 10.1 9.8 10.1 9.6 9.9 7 8 9 10 11 12 Average (Ib.) 9.7 9.8 9.7 10.0 9.8 9.9 13 14 15 16 17 18 Average (Ib.) . 9.8 9.7 9.7 9.9 Day 19 20 21 22 23 24 9.8 9.9 9.8 9.6 9.8 9.7 5 6 6 9.8 10.1 a) Establish a control chart for monitoring the average weights of the bowling balls in which the upper and lower control limits are each two standard deviations from the mean. What are the values of the control limits? Upper Control Limit (UCL) = b. (round your response to two decimal places)

Step by Step Solution

There are 3 Steps involved in it

1 Expert Approved Answer
Step: 1 Unlock blur-text-image
Question Has Been Solved by an Expert!

Get step-by-step solutions from verified subject matter experts

Step: 2 Unlock
Step: 3 Unlock

Students Have Also Explored These Related General Management Questions!