

Question: Show in excel and solver please The figure below shows the nodes ( AI ) and capacities (labelled on arcs in packages/day) of a shipping
 Show in excel and solver please
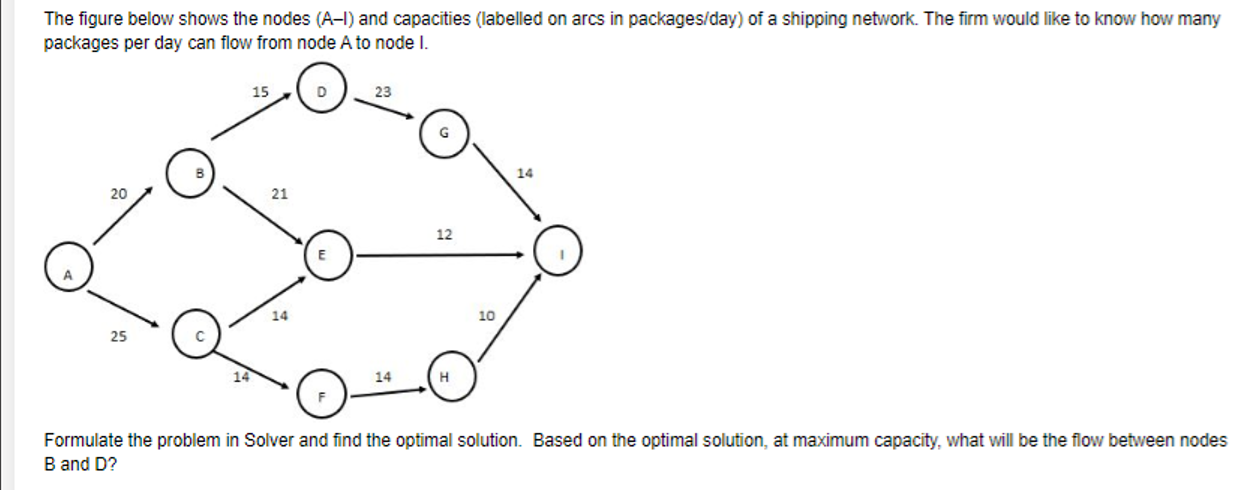
The figure below shows the nodes ( AI ) and capacities (labelled on arcs in packages/day) of a shipping network. The firm would like to know how many packages per day can flow from node A to node I. Formulate the problem in Solver and find the optimal solution. Based on the optimal solution, at maximum capacity, what will be the flow between nodes B and D
Step by Step Solution
There are 3 Steps involved in it
1 Expert Approved Answer
Step: 1 Unlock

Question Has Been Solved by an Expert!
Get step-by-step solutions from verified subject matter experts
Step: 2 Unlock
Step: 3 Unlock