

Question: Show Me How Print Item Inventory Analysis The following data were extracted from the income statement of Keever Inc.: Current Year $934,400 40,300 467,200 36,500
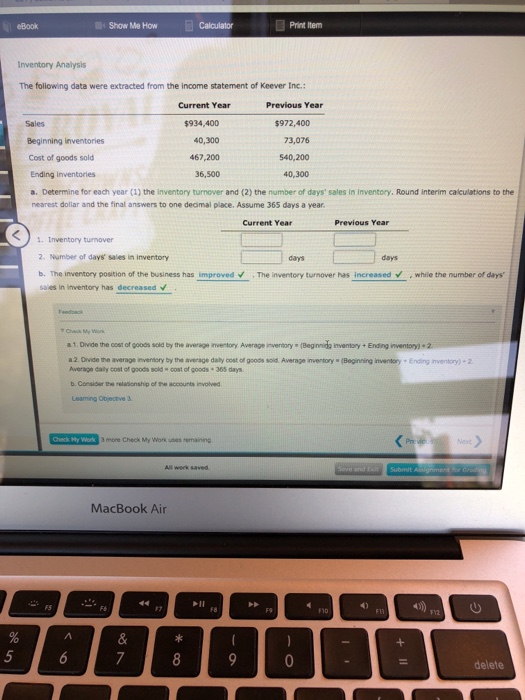
Show Me How Print Item Inventory Analysis The following data were extracted from the income statement of Keever Inc.: Current Year $934,400 40,300 467,200 36,500 Previous Year 972,400 73,076 540,200 40,300 Sales Beginning inventories Cost of goods sold Ending inventories a. Determine for each year (1) the inventory turnover and (2) the number of days' sales in inventory, Round interim calculations to the nearest dollar and the final answers to one decimal place. Assume 365 days a year Current Year Previous Year 1. Inventory turnover 2 Number of days' sales in inventory b. The inventory position of the business has improved The inventory turnover has increased-/ , whie the number of days, sales in inventory has decreased a t. Divide the cost of goods sold by the average inventory Average invertory (Beginnida inventory+Ending inentory).2 a 2. Divide the average invetory by the average daly cost of goods soid. Average inventory (Beginning inventory Ending inventory)-2 Average daily cost of goods sold- cost of goods 365 days b. Consider the elasonship of the accounts involved Leaming Objective 3 3 mone Check My Work uses emaining MacBook Air 5 delete
Step by Step Solution
There are 3 Steps involved in it

Get step-by-step solutions from verified subject matter experts