

Question: show me on how to do the graph please the instruction on the buttom The tabie below shows the density of water at various temperatures.
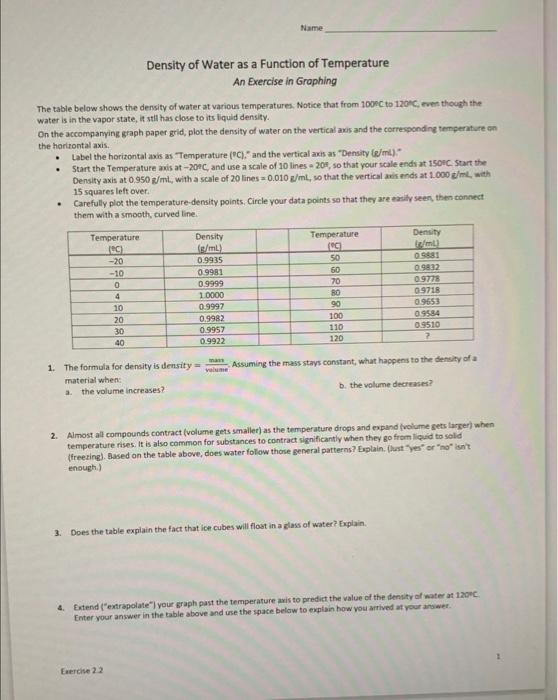
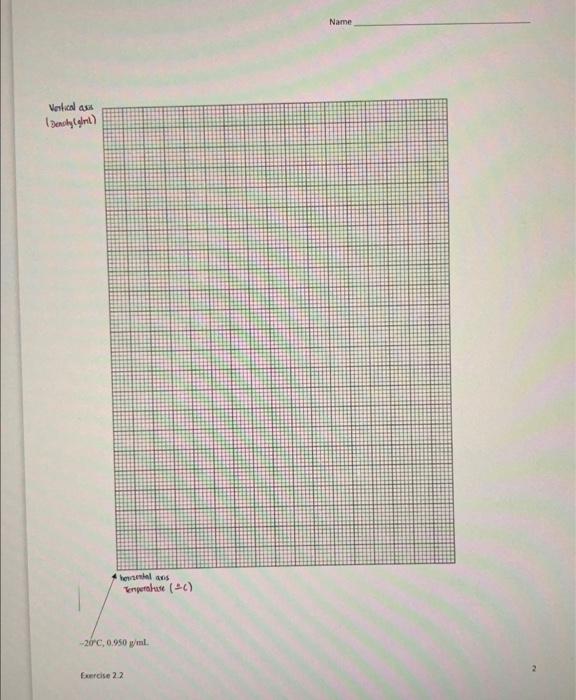
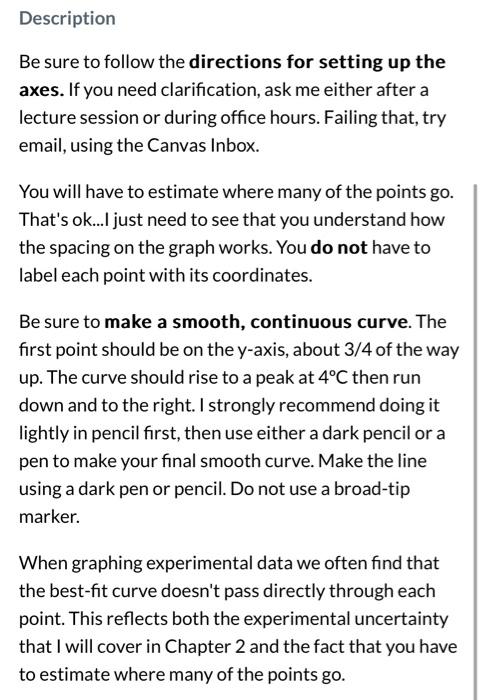
The tabie below shows the density of water at various temperatures. Notice that from 1008C to 120 fic eren though the Water is in the vapor state, it stll has close to its liquid density. On the accomparying graph paper grid, plot the density of water on the vertical axis and the corresponding temperat ore cin the horirontal axis. - Label the horizontal axis as "Temperature (PC)." and the vertical axis as "Density (g/ml) " - Start the Temperature amis at 201C and use a scale of 10 lines a 209 , so that your scale ends at 150 ic start the Density axis at 0,950e/mil, with a scale of 20 lines =0.010g/mL, so that the vertical aris ands at 1.000g/m. with 15 squares left over. - Carefully plot the temperature-density points. Circle your data points sa that they are easily seen, then connect them with a smooth, curved line. 1. The formula for density is denrity =vilume.mam. Assuming the mass stays constant, what happens to the density of a material when: a. the volume increases? b. the volume decrases? 2. Almost all compounds contract (volume gets smallet) as the temperature drops and expand fivilume gets larker) when temperature rises: It is also common for substances to contract significantly when they go from licuid to sold (freesing). Aased on the table above, does water folow those general patterns? Eoplain. flust "yes" or "no" iont. enough.) 3. Does the table expiain the fact that ice cubes will flost in a glass of water? Explain. 4. Extend ("extrapolate") you \&raph past the temperature axis to predict the value of the denity of water at 1 ageC. Enter your answer in the bable above and use the space below to explain how you arrived at your arower. Name hennenal ans Terperalude (CE) 29+C,0.950g/ml Ferrise 22 Description Be sure to follow the directions for setting up the axes. If you need clarification, ask me either after a lecture session or during office hours. Failing that, try email, using the Canvas Inbox. You will have to estimate where many of the points go. That's ok...I just need to see that you understand how the spacing on the graph works. You do not have to label each point with its coordinates. Be sure to make a smooth, continuous curve. The first point should be on the y-axis, about 3/4 of the way up. The curve should rise to a peak at 4C then run down and to the right. I strongly recommend doing it lightly in pencil first, then use either a dark pencil or a pen to make your final smooth curve. Make the line using a dark pen or pencil. Do not use a broad-tip marker. When graphing experimental data we often find that the best-fit curve doesn't pass directly through each point. This reflects both the experimental uncertainty that I will cover in Chapter 2 and the fact that you have to estimate where many of the points go
Step by Step Solution
There are 3 Steps involved in it

Get step-by-step solutions from verified subject matter experts