

Question: Show me the steps to solve 4 . Using the provided Depression Student Dataset, apply visual analytics and data manipulation techniques. Below are the questions,
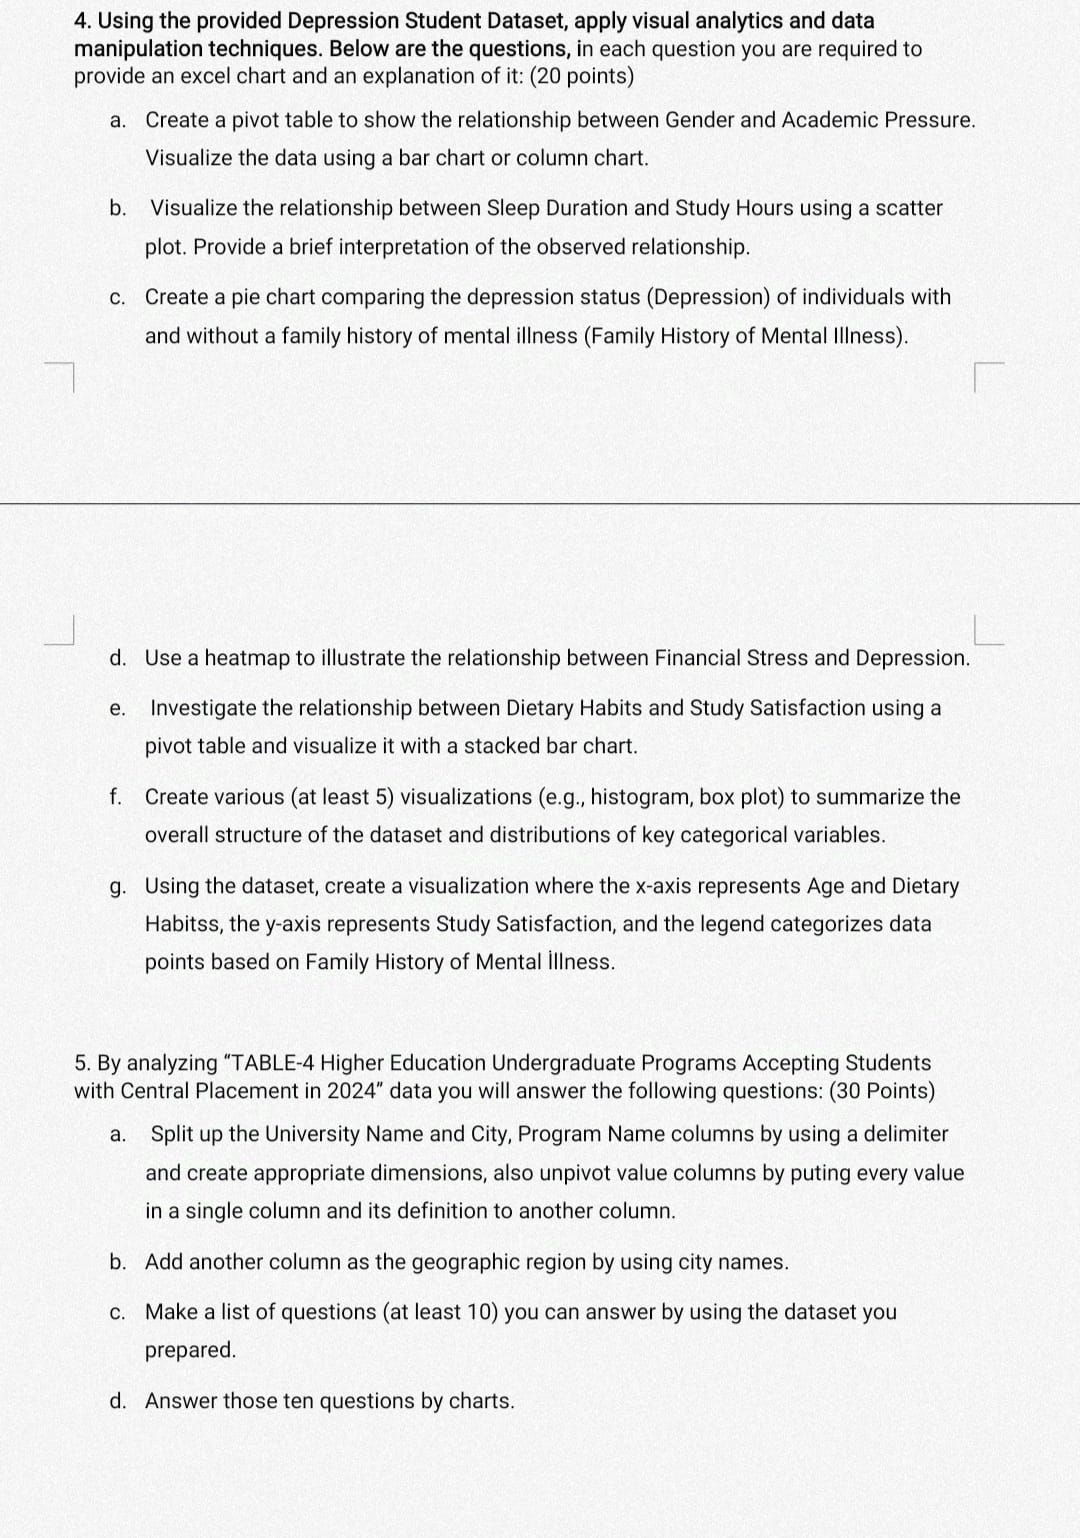
Show me the steps to solve Using the provided Depression Student Dataset, apply visual analytics and data manipulation techniques. Below are the questions, in each question you are required to provide an excel chart and an explanation of it: points
a Create a pivot table to show the relationship between Gender and Academic Pressure. Visualize the data using a bar chart or column chart.
b Visualize the relationship between Sleep Duration and Study Hours using a scatter plot. Provide a brief interpretation of the observed relationship.
c Create a pie chart comparing the depression status Depression of individuals with and without a family history of mental illness Family History of Mental Illness
d Use a heatmap to illustrate the relationship between Financial Stress and Depression.
e Investigate the relationship between Dietary Habits and Study Satisfaction using a pivot table and visualize it with a stacked bar chart.
f Create various at least visualizations eg histogram, box plot to summarize the overall structure of the dataset and distributions of key categorical variables.
g Using the dataset, create a visualization where the x axis represents Age and Dietary Habitss, the y axis represents Study Satisfaction, and the legend categorizes data points based on Family History of Mental Illness.
By analyzing "TABLE Higher Education Undergraduate Programs Accepting Students with Central Placement in data you will answer the following questions: Points
a Split up the University Name and City, Program Name columns by using a delimiter and create appropriate dimensions, also unpivot value columns by puting every value in a single column and its definition to another column.
b Add another column as the geographic region by using city names.
c Make a list of questions at least you can answer by using the dataset you prepared.
d Answer those ten questions by charts.
Step by Step Solution
There are 3 Steps involved in it
1 Expert Approved Answer
Step: 1 Unlock

Question Has Been Solved by an Expert!
Get step-by-step solutions from verified subject matter experts
Step: 2 Unlock
Step: 3 Unlock