

Question: show step by step using appropriate formula and test statistic for this question. all and explain why this particular test statistic was used. write hypothesis
show step by step using appropriate formula and test statistic for this question. all and explain why this particular test statistic was used. write hypothesis as well as finding p value in addition to this scanned question.
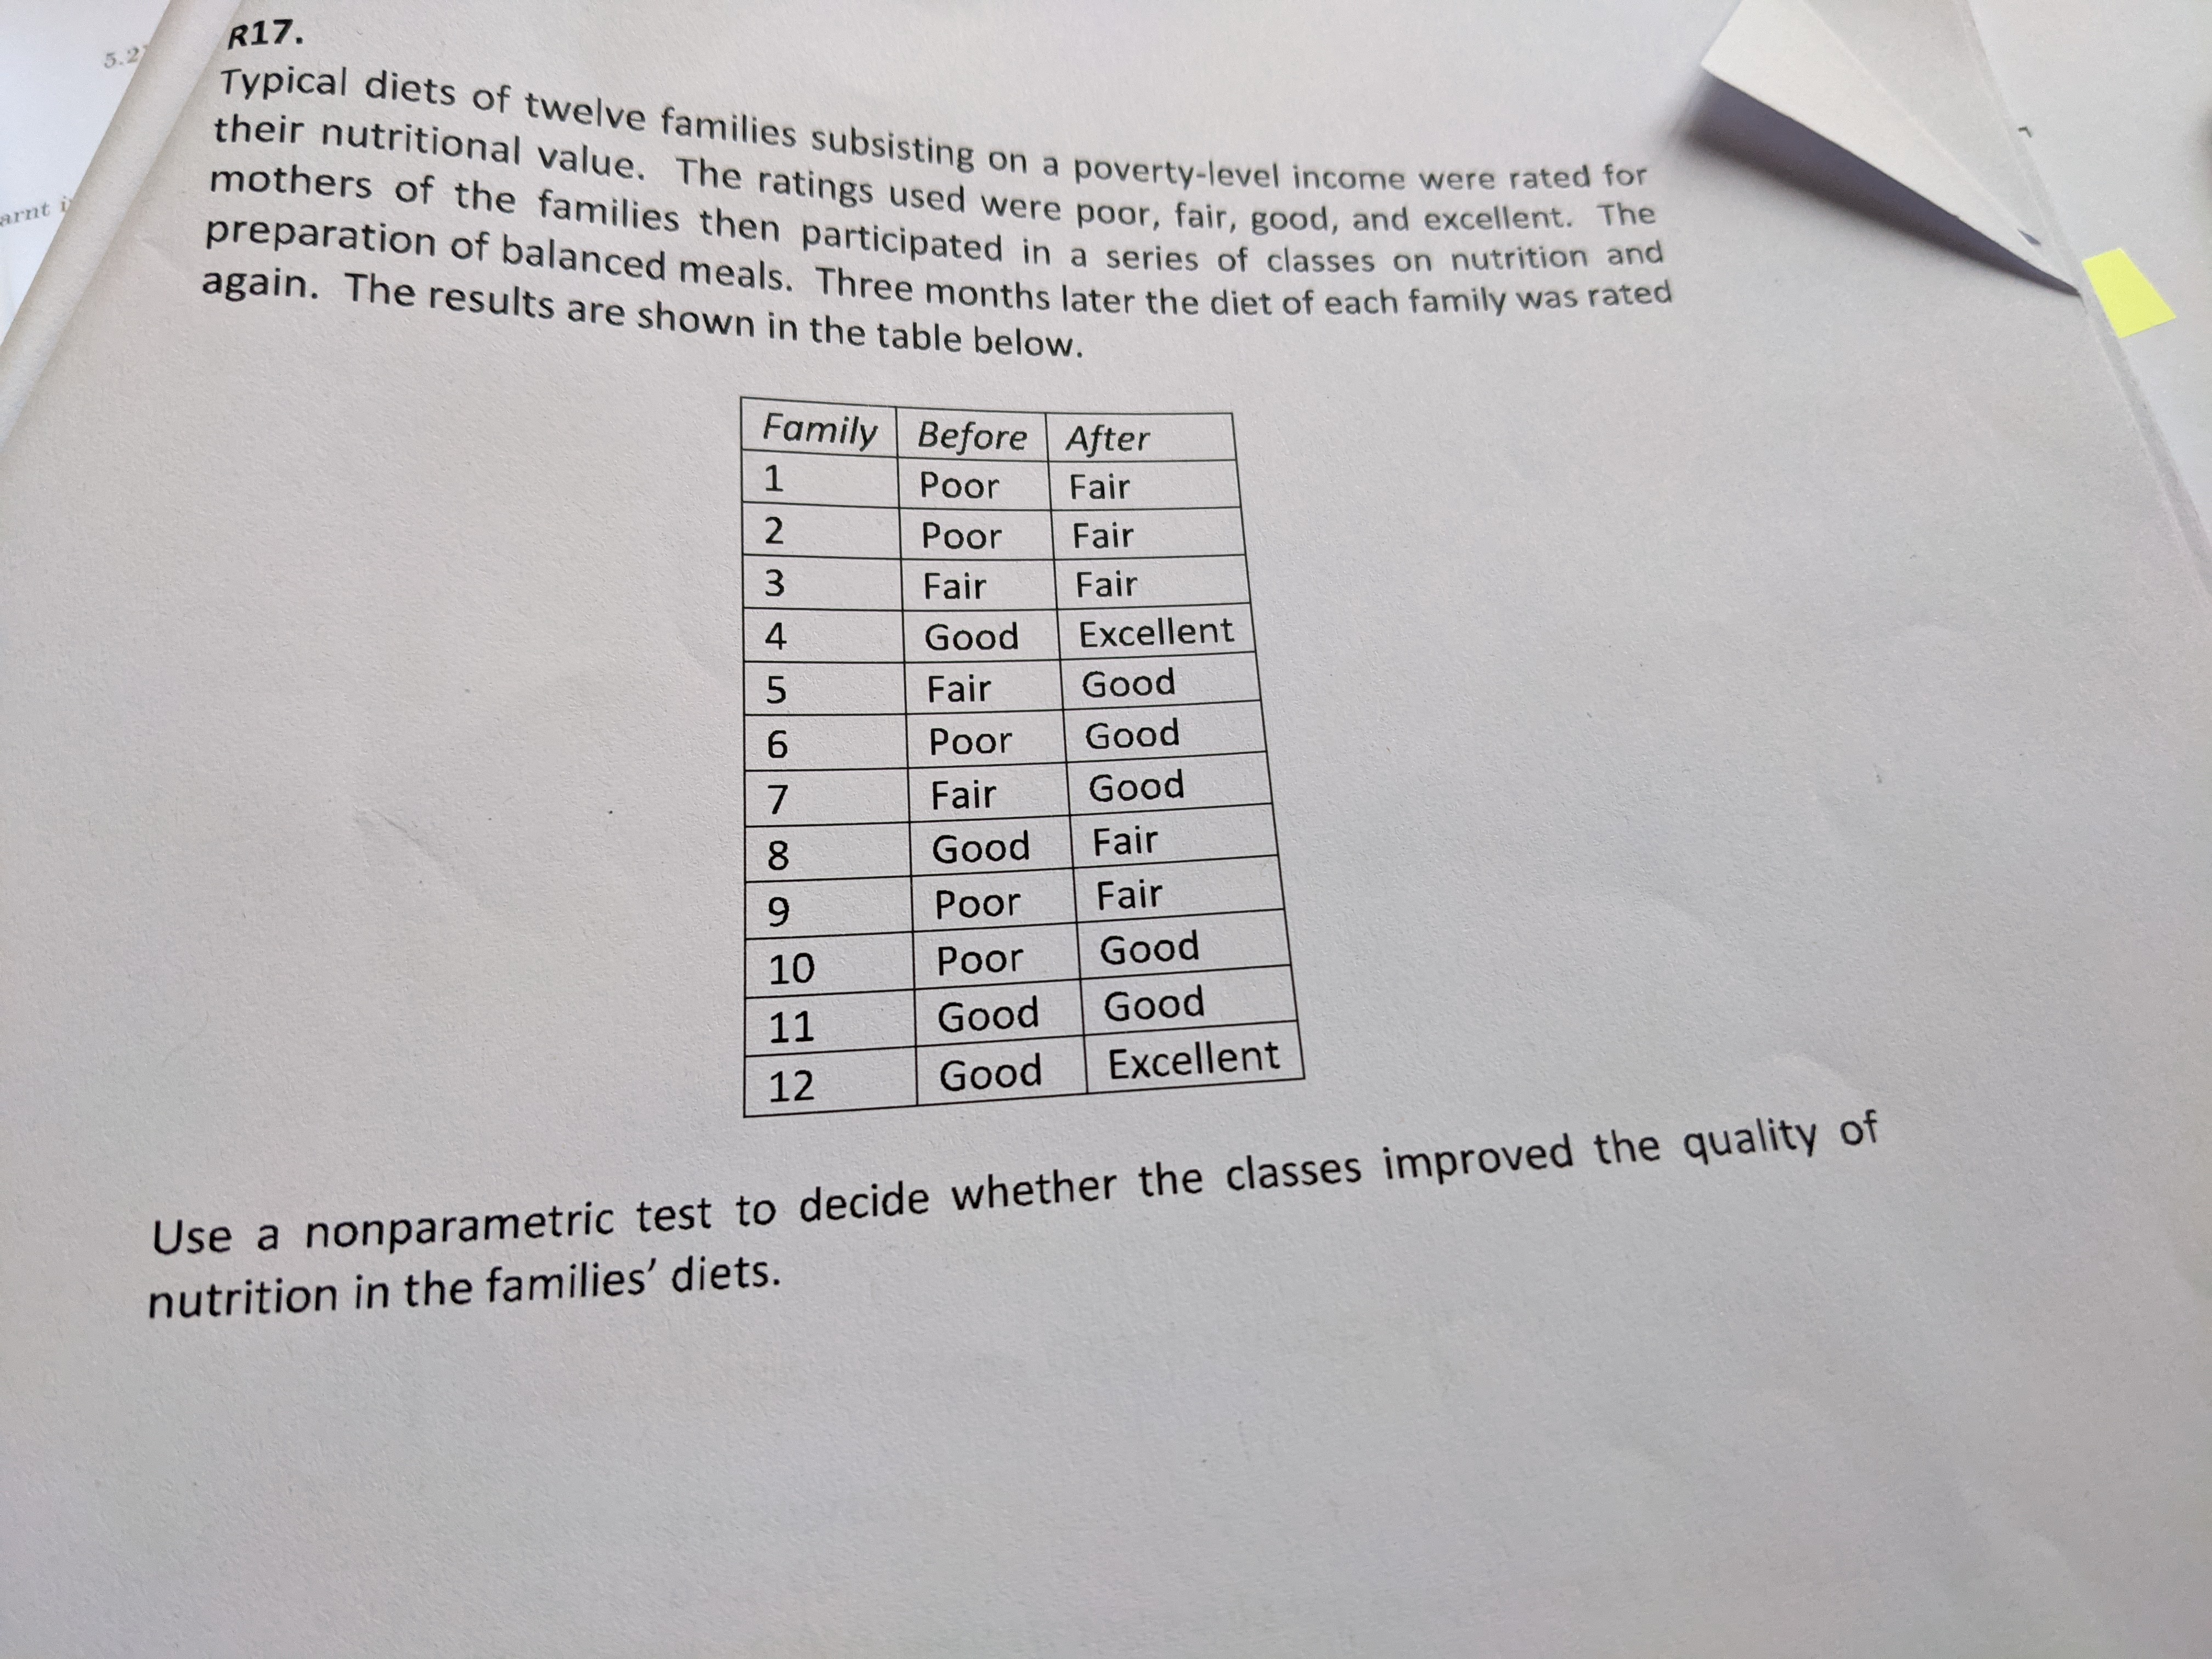
R17. Typical diets of twelve families subsisting on a poverty-level income were rated for arnt their nutritional value. The ratings used were poor, fair, good, and excellent. The mothers of the families then participated in a series of classes on nutrition and preparation of balanced meals. Three months later the diet of each family was rated again. The results are shown in the table below. Family Before After 1 Poor Fair 2 Poor Fair 3 Fair Fair 4 Good Excellent 5 Fair Good 6 Poor Good 7 Fair Good 8 Good Fair 9 Poor Fair 10 Poor Good 11 Good Good 12 Good Excellent Use a nonparametric test to decide whether the classes improved the quality of nutrition in the families' diets
Step by Step Solution
There are 3 Steps involved in it

Get step-by-step solutions from verified subject matter experts