

Question: show steps and any formulas please, answer question 5-7 14.31 1,052,800 8.33 3 4 1, -5 Sales price per unit 6 Total fixed costs 7
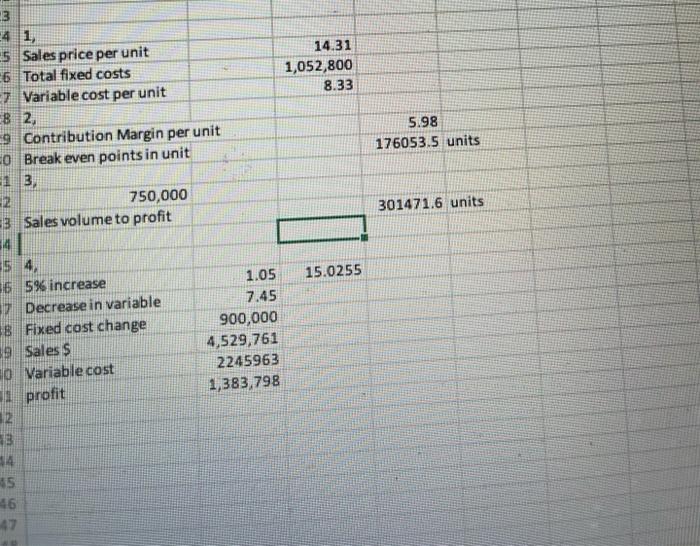
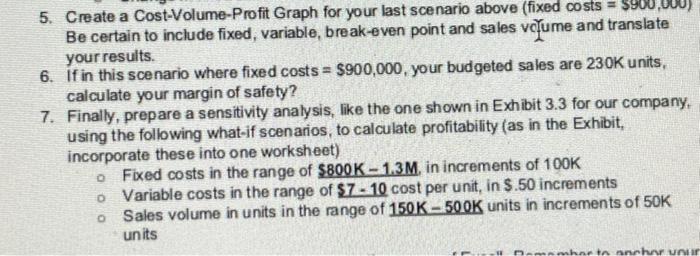
14.31 1,052,800 8.33 3 4 1, -5 Sales price per unit 6 Total fixed costs 7 Variable cost per unit B 2. 9 Contribution Margin per unit 0 Break even points in unit 13) 2 750,000 3 Sales volume to profit 5.98 176053.5 units 301471.6 units 15.0255 5 4. 6 596 increase 7 Decrease in variable 38 Fixed cost change 39 Sales $ O Variable cost profit 12 13 1.05 7.45 900,000 4,529,761 2245963 1,383,798 45 46 47 5. Create a Cost-Volume-Profit Graph for your last scenario above (fixed costs = $900,000) Be certain to include fixed, variable, break-even point and sales volume and translate your results. 6. If in this scenario where fixed costs = $900,000, your budgeted sales are 230K units, calculate your margin of safety? 7. Finally, prepare a sensitivity analysis, like the one shown in Exhibit 3.3 for our company, using the following what-if scenarios, to calculate profitability (as in the Exhibit, incorporate these into one worksheet) o Fixed costs in the range of $800K - 1.3M. in increments of 100K o Variable costs in the range of $7 - 10 cost per unit, in $.50 increments Sales volume in units in the range of 150 K - 500K units in increments of 50K units O ha un
Step by Step Solution
There are 3 Steps involved in it

Get step-by-step solutions from verified subject matter experts