

Question: Show steps and Excel Output Chapter 11 11.21, a, b, c, d, e; use data file PGA 11.23; use data file TWEETS 11.45, a, b;
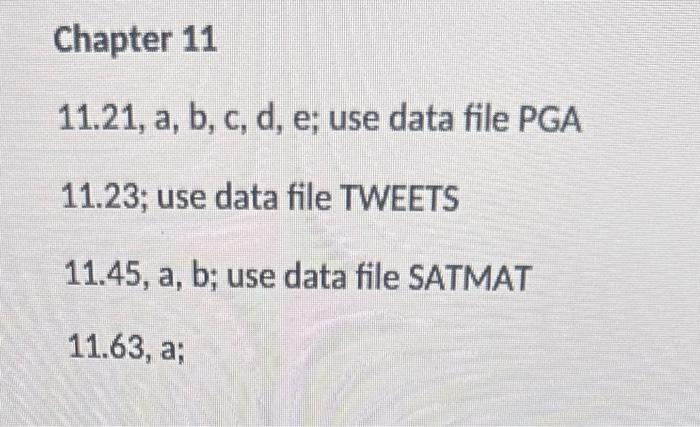
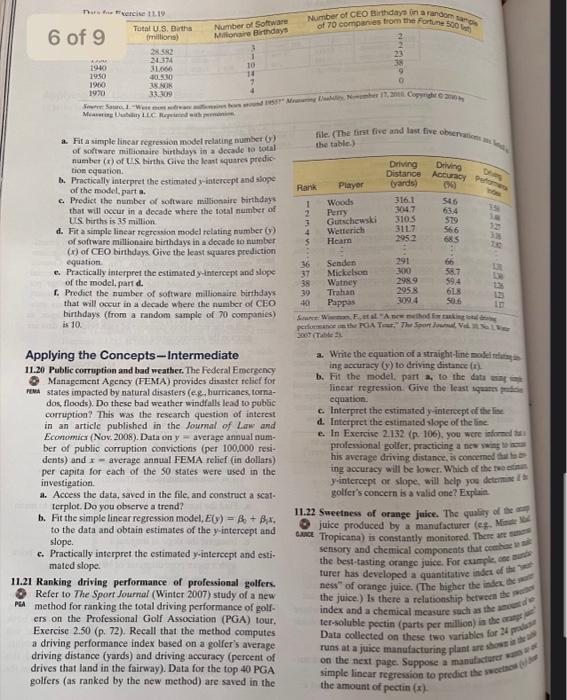
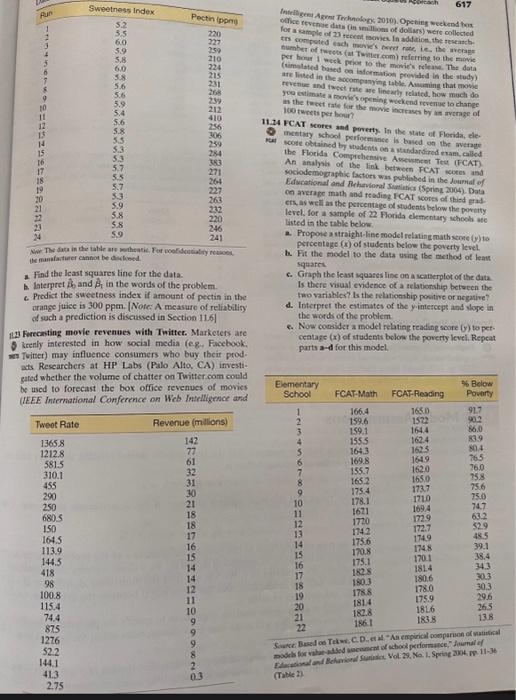
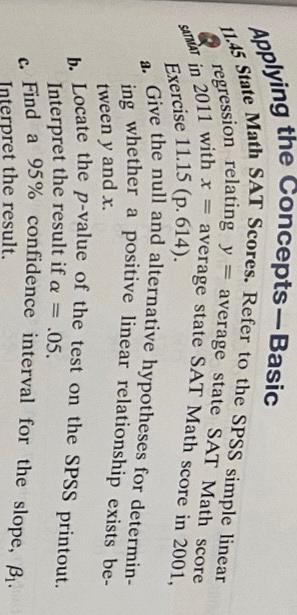
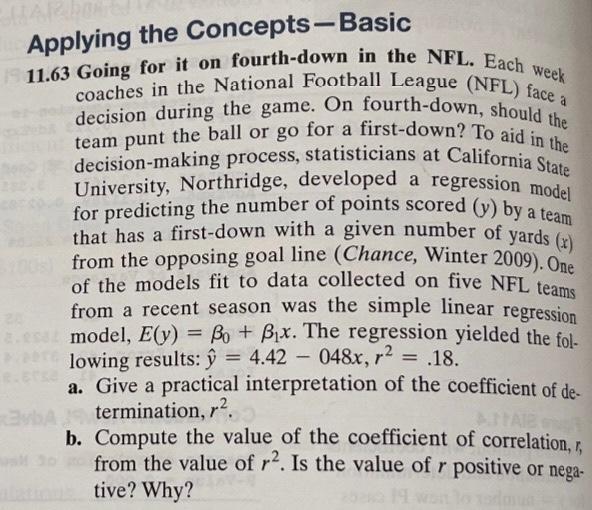
Chapter 11 11.21, a, b, c, d, e; use data file PGA 11.23; use data file TWEETS 11.45, a, b; use data file SATMAT 11.63, a; Nura tho treercice 11.10 Applying the UOHCepts-Basic 11.45 State Math SAT Scores. Refer to the SPSS simple linear 2. regression relating y= average state SAT Math score in 2011 with x= average state SAT Math score in 2001, Exercise 11.15( p. 614). a. Give the null and alternative hypotheses for determining whether a positive linear relationship exists between y and x. b. Locate the p-value of the test on the SPSS printout. Interpret the result if =.05. c. Find a 95% confidence interval for the slope, 1. Interpret the result. Applying the Concepts 11.63 Going for it on fourth-down in the NFL. Each week coaches in the National Football League (NFL) face a decision during the game. On fourth-down, should the team punt the ball or go for a first-down? To aid in the decision-making process, statisticians at California State University, Northridge, developed a regression model for predicting the number of points scored (y) by a team from the opposing goal line (Chance, Winter 2009). One of the models fit to data collected on five NFL teams from a recent season was the simple linear regression model, E(y)=0+1x. The regression yielded the fol. lowing results: y^=4.42048x,r2=.18. a. Give a practical interpretation of the coefficient of determination, r2. b. Compute the value of the coefficient of correlation, r, from the value of r2. Is the value of r positive or negative? Why
Step by Step Solution
There are 3 Steps involved in it

Get step-by-step solutions from verified subject matter experts