

Question: show steps, please Problem #4 (30 pts) Design specifications require that a key dimension on a product measure 1750100 units. A process being considered for
 show steps, please
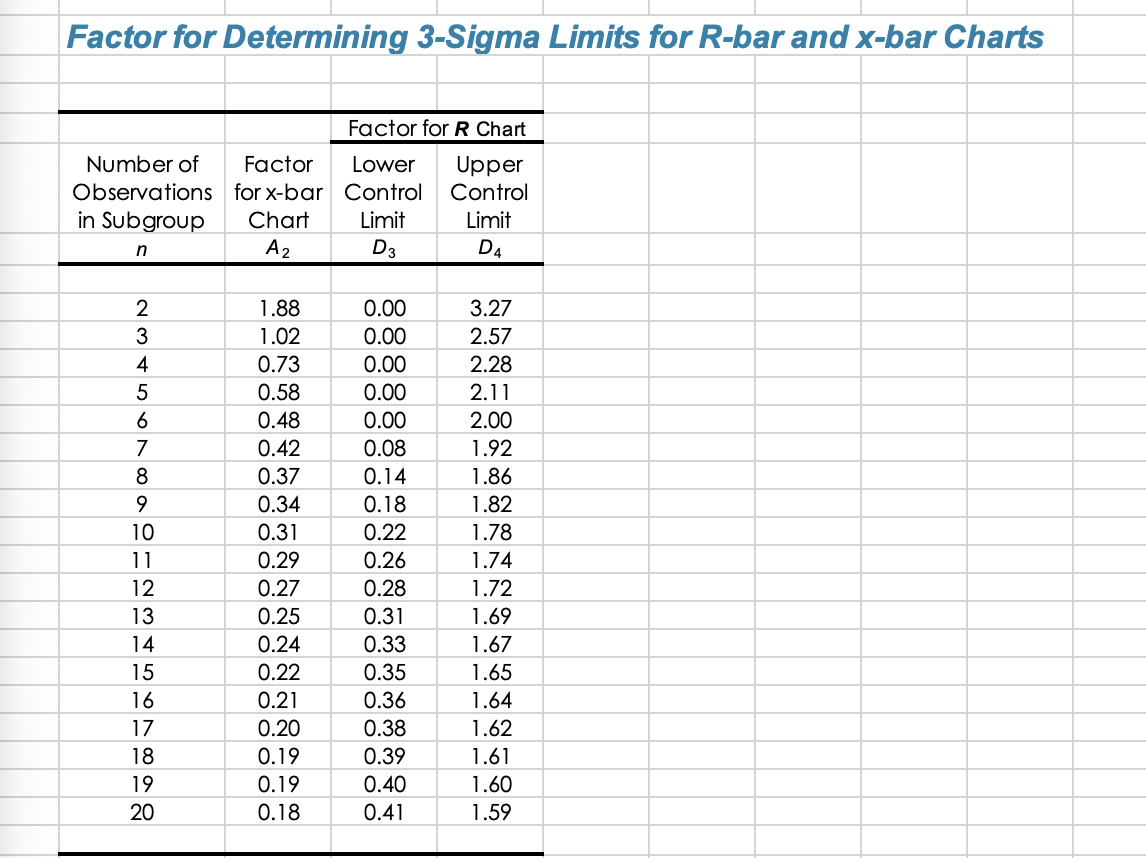
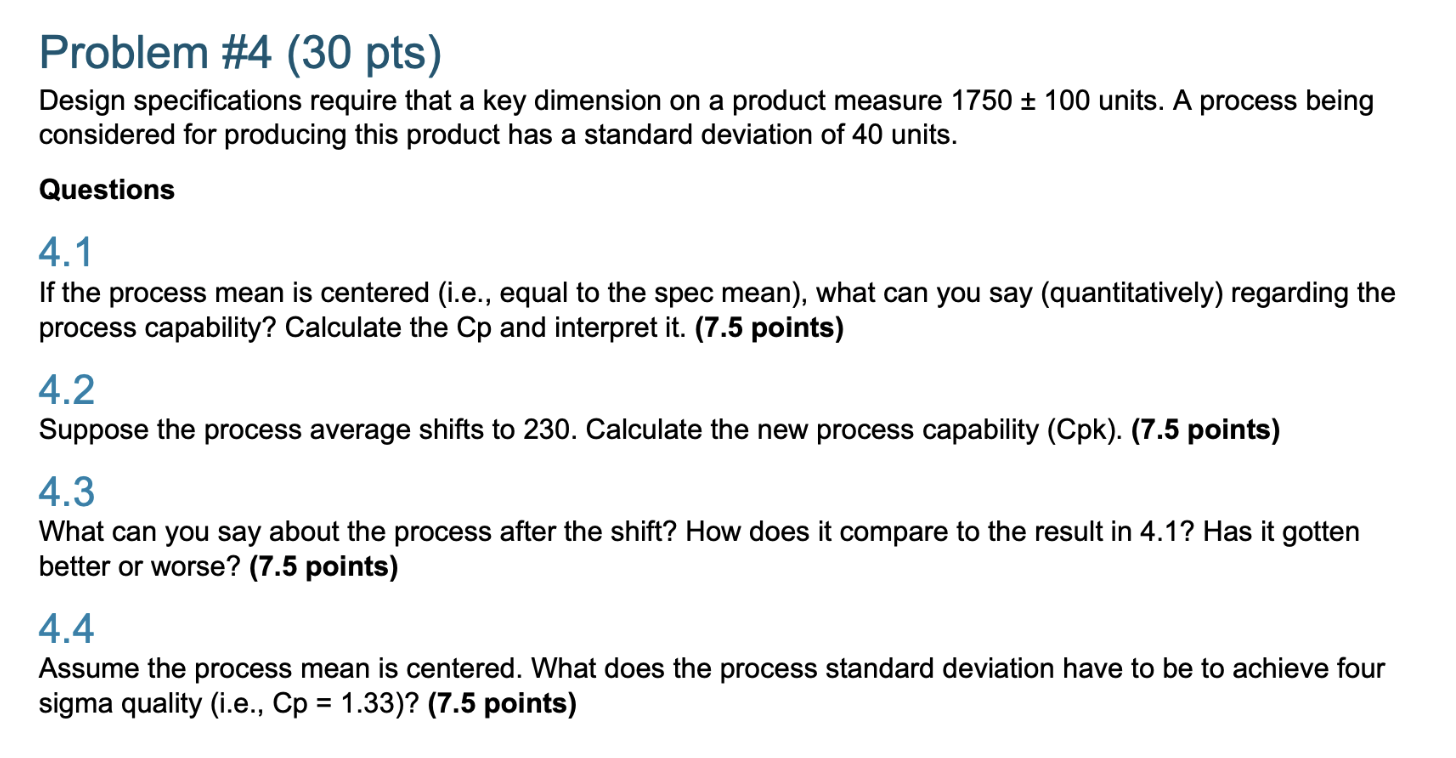
Problem \#4 (30 pts) Design specifications require that a key dimension on a product measure 1750100 units. A process being considered for producing this product has a standard deviation of 40 units. Questions 4.1 If the process mean is centered (i.e., equal to the spec mean), what can you say (quantitatively) regarding the process capability? Calculate the Cp and interpret it. (7.5 points) 4.2 Suppose the process average shifts to 230 . Calculate the new process capability (Cpk). ( 7.5 points) 4.3 What can you say about the process after the shift? How does it compare to the result in 4.1? Has it gotten better or worse? (7.5 points) 4.4 Assume the process mean is centered. What does the process standard deviation have to be to achieve four sigma quality (i.e., Cp=1.33) ? (7.5 points) Factor for Determining 3-Sigma Limits for R-bar and x-bar Charts \begin{tabular}{|c|c|c|c|} \hline & & \multicolumn{2}{|c|}{ Factor for R Chart } \\ \cline { 3 - 4 } \begin{tabular}{c} Number of \\ Observations \\ in Subgroup \end{tabular} & \begin{tabular}{c} Factor \\ for x-bar \\ Chart \end{tabular} & \begin{tabular}{c} Lower \\ Control \\ Limit \end{tabular} & \begin{tabular}{c} Upper \\ Control \\ Limit \end{tabular} \\ \hlinen & A2 & D3 & D4 \\ \hline 2 & & & \\ \hline 3 & 1.88 & 0.00 & 3.27 \\ \hline 4 & 1.02 & 0.00 & 2.57 \\ \hline 5 & 0.73 & 0.00 & 2.28 \\ \hline 6 & 0.58 & 0.00 & 2.11 \\ \hline 7 & 0.48 & 0.00 & 2.00 \\ \hline 8 & 0.42 & 0.08 & 1.92 \\ \hline 9 & 0.37 & 0.14 & 1.86 \\ \hline 10 & 0.34 & 0.18 & 1.82 \\ \hline 11 & 0.31 & 0.22 & 1.78 \\ \hline 12 & 0.29 & 0.26 & 1.74 \\ \hline 13 & 0.27 & 0.28 & 1.72 \\ \hline 14 & 0.25 & 0.31 & 1.69 \\ \hline 15 & 0.24 & 0.33 & 1.67 \\ \hline 16 & 0.22 & 0.35 & 1.65 \\ \hline 17 & 0.21 & 0.36 & 1.64 \\ \hline 18 & 0.20 & 0.38 & 1.62 \\ \hline 19 & 0.19 & 0.39 & 1.61 \\ \hline 20 & 0.19 & 0.40 & 1.60 \\ \hline & 0.18 & 0.41 & 1.59 \\ \hline \end{tabular}
Step by Step Solution
There are 3 Steps involved in it

Get step-by-step solutions from verified subject matter experts