

Question: Show the full input , calculation , and interpretation of the ratio in the following: - Asset turnover - Return on Assets - Current ratio
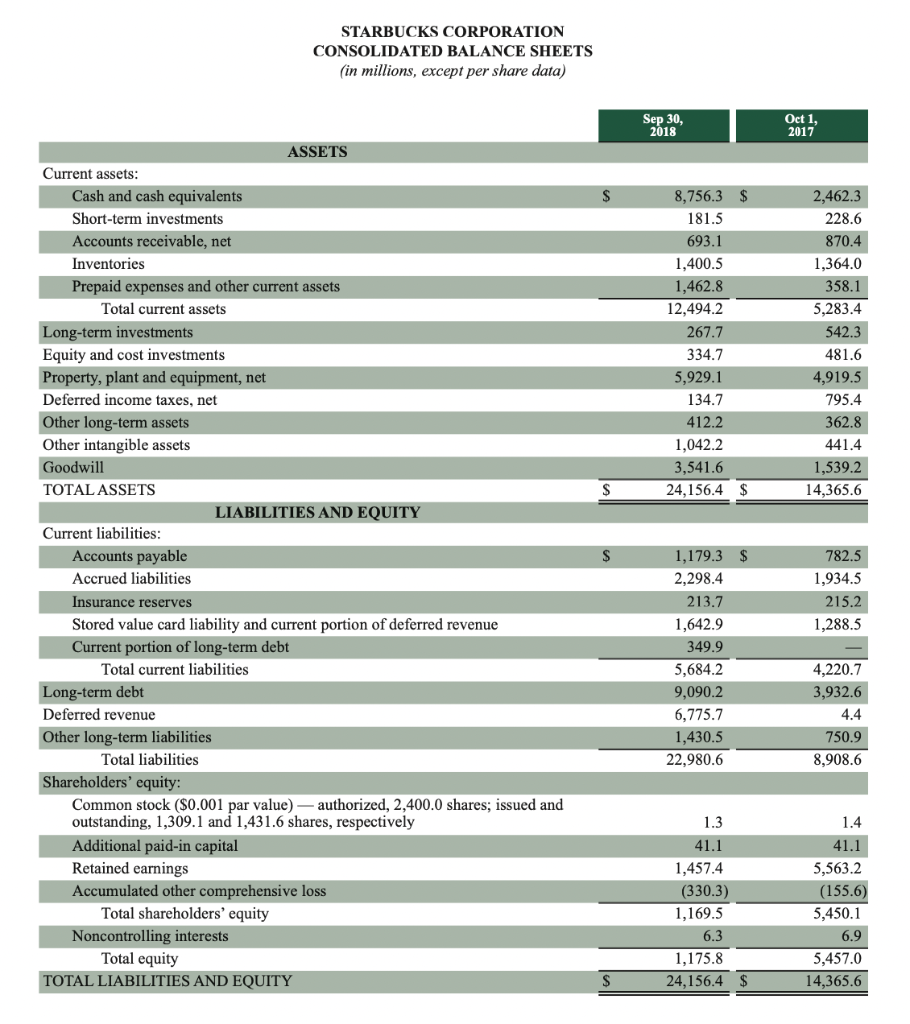
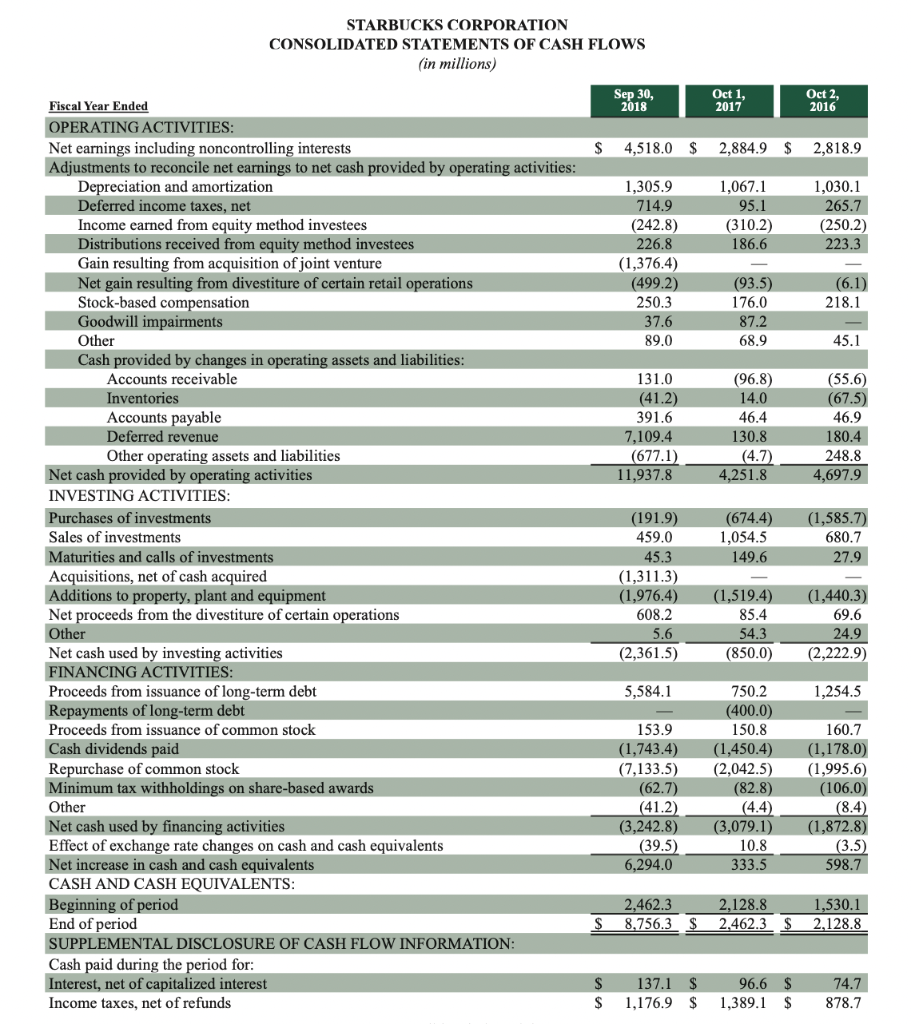
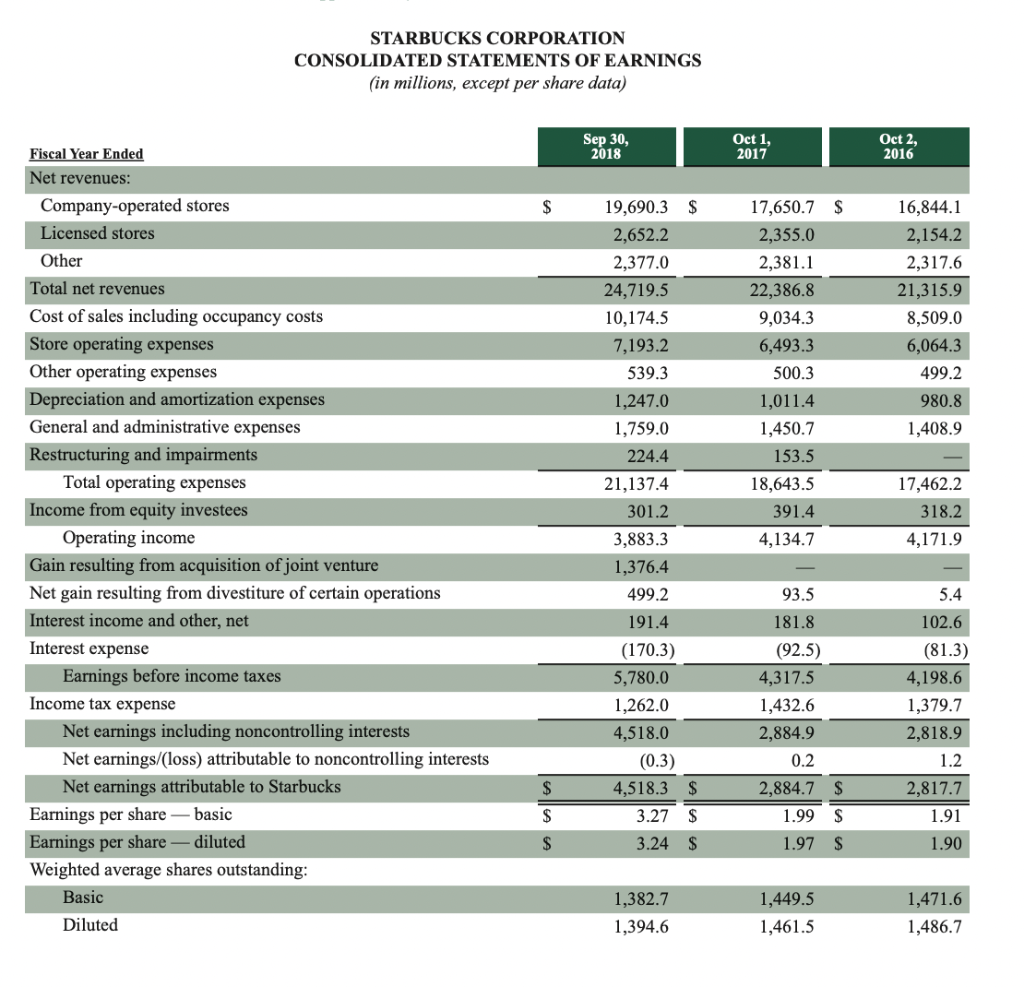
Show the full input, calculation, and interpretation of the ratio in the following:
- Asset turnover
- Return on Assets
- Current ratio
- Quick ratio for 2017
- Debt ratio
STARBUCKS CORPORATION CONSOLIDATED BALANCE SHEETS (in millions, except per share data) Sep 30, 2018 Oct 1, 2017 $ 8,756.3 $ 181.5 693.1 1,400.5 1,462.8 12,494.2 267.7 334.7 5,929.1 134.7 412.2 1,042.2 3,541.6 24,156.4 $ 2,462.3 228.6 870.4 1,364.0 358.1 5,283.4 542.3 481.6 4,919.5 795.4 362.8 441.4 1,539.2 14,365.6 $ $ ASSETS Current assets: Cash and cash equivalents Short-term investments Accounts receivable, net Inventories Prepaid expenses and other current assets Total current assets Long-term investments Equity and cost investments Property, plant and equipment, net Deferred income taxes, net Other long-term assets Other intangible assets Goodwill TOTAL ASSETS LIABILITIES AND EQUITY Current liabilities: Accounts payable Accrued liabilities Insurance reserves Stored value card liability and current portion of deferred revenue Current portion of long-term debt Total current liabilities Long-term debt Deferred revenue Other long-term liabilities Total liabilities Shareholders' equity: Common stock ($0.001 par value) - authorized, 2,400.0 shares; issued and outstanding, 1,309.1 and 1,431.6 shares, respectively Additional paid-in capital Retained earnings Accumulated other comprehensive loss Total shareholders' equity Noncontrolling interests Total equity TOTAL LIABILITIES AND EQUITY 782.5 1,934.5 215.2 1,288.5 1,179.3 2,298.4 213.7 1,642.9 349.9 5,684.2 9,090.2 6,775.7 1,430.5 22,980.6 4.220.7 3,932.6 4.4 750.9 8,908.6 1.3 41.1 1,457.4 (330.3) 1,169.5 6.3 1,175.8 24,156.4 $ 1.4 41.1 5,563.2 (155.6) 5,450.1 6.9 5,457.0 14,365.6 STARBUCKS CORPORATION CONSOLIDATED STATEMENTS OF CASH FLOWS (in millions) Sep 30, 2018 Oct 1, 2017 Oct 2, 2016 $ 4,518.0 $ 2,884.9 $ 2,818.9 1,305.9 714.9 (242.8) 226.8 (1,376.4) (499.2) 250.3 1,067.1 95.1 (310.2) 186.6 1,030.1 265.7 (250.2) 223.3 (6.1) 218.1 (93.5) 176.0 87.2 68.9 37.6 89.0 45.1 131.0 (41.2) 391.6 7,109.4 (677.1) 11,937.8 (96.8) 14.0 46.4 130.8 (4.7) 4,251.8 (55.6 (67.5) 46.9 180.4 248.8 4,697.9 Fiscal Year Ended OPERATING ACTIVITIES: Net earnings including noncontrolling interests Adjustments to reconcile net earnings to net cash provided by operating activities: Depreciation and amortization Deferred income taxes, net Income earned from equity method investees Distributions received from equity method investees Gain resulting from acquisition of joint venture Net gain resulting from divestiture of certain retail operations Stock-based compensation Goodwill impairments Other Cash provided by changes in operating assets and liabilities: Accounts receivable Inventories Accounts payable Deferred revenue Other operating assets and liabilities Net cash provided by operating activities INVESTING ACTIVITIES: Purchases of investments Sales of investments Maturities and calls of investments Acquisitions, net of cash acquired Additions to property, plant and equipment Net proceeds from the divestiture of certain operations Other Net cash used by investing activities FINANCING ACTIVITIES: Proceeds from issuance of long-term debt Repayments of long-term debt Proceeds from issuance of common stock Cash dividends paid Repurchase of common stock Minimum tax withholdings on share-based awards Other Net cash used by financing activities Effect of exchange rate changes on cash and cash equivalents Net increase in cash and cash equivalents CASH AND CASH EQUIVALENTS: Beginning of period End of period SUPPLEMENTAL DISCLOSURE OF CASH FLOW INFORMATION: Cash paid during the period for: Interest, net of capitalized interest Income taxes, net of refunds (674.4) 1,054.5 149.6 (1,585.7) 680.7 27.9 (191.9) 459.0 45.3 (1,311.3) (1,976.4) 608.2 5.6 (2,361.5) (1,519.4) 85.4 54.3 (850.0) (1,440.3) 69.6 24.9 (2,222.9) 5,584.1 1,254.5 153.9 (1,743.4) (7,133.5) (62.7) (41.2) (3,242.8) (39.5) 6,294.0 750.2 (400.0) 150.8 (1,450.4) (2,042.5) (82.8) (4.4) (3,079.1) 10.8 333.5 160.7 (1,178.0) (1,995.6) (106.0 (8.4) (1,872.8) (3.5) 598.7 2,462.3 $ 8,756.3 2,128.8 2,462.3 $ 1,530.1 2,128.8 $ $ 137.1 $ 1,176.9 $ 96.6 $ 1,389.1 $ 74.7 878.7 STARBUCKS CORPORATION CONSOLIDATED STATEMENTS OF EQUITY (in millions, except per share data) Common Stock Shares 1,485.1 $ Additional Paid- Amount in Capital 1.5 $ 41.1 Retained Earnings 5,974.8 2,817.7 Accumulated Other Comprehensive Shareholders' Noncontrolling Income/(Loss) Equity Interests (199.4) $ 5,818.0 $ 1.8 $ 2,817.7 1.2 91.0 91.0 219.6 Total 5,819.8 2,818.9 91.0 219.6 219.6 153.0 9.8 0.5 153.0 26.5 153.0 26.5 (1,995.6) (1,246.2) (349) (399.1) (1,596.5) (1,246.2) - 3.7 26.5 (1,995.6) (1,246.2) 3.7 5,890.7 2,884.9 (47.2) 177.9 1,460.5 1.5 41.1 $ (108.4) $ 6.7 $ 5,949.8 $ 2,884.7 0.2 5,884.0 $ 2,884.7 (47.2) 177.9 (47.2) 177.9 Balance, September 27, 2015 Net earnings Other comprehensive income Stock-based compensation expense Exercise of stock options/vesting of RSUS, including tax benefit of $124.3 Sale of common stock, including tax benefit of $0.2 Repurchase of common stock Cash dividends declared, $0.85 per share Noncontrolling interest resulting from acquisition Balance, October 2, 2016 Net earnings Other comprehensive income/(loss) Stock-based compensation expense Exercise of stock options/vesting of RSUS, including tax benefit of $77.4 Sale of common stock, including tax benefit of $0.2 Repurchase of common stock Cash dividends declared, $1.05 per share Balance, October 1, 2017 Net earnings/(loss) Other comprehensive income/(loss) Stock-based compensation expense Exercise of stock options/vesting of RSUS Sale of common stock Repurchase of common stock Cash dividends declared, $1.32 per share Net distributions to noncontrolling interests Balance, September 30, 2018 8.1 0.5 (37.5) 117.0 28.7 (0.1) (323.6) (1,755.4) (1,515.9) 5,563.2 4,518.3 117.0 28.7 (2,079.1) (1,515.9) 5,450.1 $ 4,518.3 (174.7) 253.8 1,431.6 $ 1.4 $ 41.1 $ (155.6) $ 6.9 $ (0.3) 117.0 28.7 (2,079.1) (1,515.9) 5,457.0 4,518.0 (174.7) 253.8 59.4 31.8 (7,208.7) (1,760.5) (174.7) 253.8 8.4 0.6 59.4 31.8 59.4 31.8 (7,208.7) (1,760.5) (131.5) (0.1) (345.0) (6,863.6) (1,760.5) (0.3) (0.3) 6.3 1,309.1 $ 1.3 $ 41.1 $ 1,457.4 $ (330.3) $ 1,169.5 $ 1,175.8 See Notes to Consolidated Financial Statements. STARBUCKS CORPORATION CONSOLIDATED STATEMENTS OF COMPREHENSIVE INCOME (in millions) Sep 30, 2018 Oct 1, 2017 2,884.9 $ Oct 2, 2016 2,818.9 $ 4,518.0 $ (7.0) 1.9 24.4 (6.5) 7.8 (2.2) (220.0) (9.5) 2.9 53.2 (12.6) 20.1 Fiscal Year Ended Net earnings including noncontrolling interests Other comprehensive income/(loss), net of tax: Unrealized holding gains/(losses) on available-for-sale securities Tax (expense) benefit Unrealized gains/(losses) on cash flow hedging instruments Tax (expense)/benefit Unrealized gains/(losses) on net investment hedging instruments Tax (expense) benefit Translation adjustment and other Tax (expense)/benefit Reclassification adjustment for net (gains)/losses realized in net earnings for available-for-sale securities, hedging instruments, and translation adjustment Tax expense/(benefit) Other comprehensive income/(loss) Comprehensive income including noncontrolling interests Comprehensive income/(loss) attributable to noncontrolling interests Comprehensive income attributable to Starbucks 3.5 (1.3) (109.6) 27.5 (7.4) (38.3) (2.4) 85.5 3.4 19.0 (67.2) 14.0 24.7 (1.2) (174.7) 4,343.3 (0.3) 4,343.6 $ (47.2) 2,837.7 0.2 78.2 (11.8) 91.0 2,909.9 1.2 $ 2,837.5 $ 2,908.7 STARBUCKS CORPORATION CONSOLIDATED STATEMENTS OF EARNINGS (in millions, except per share data) Sep 30, 2018 Oct 1, 2017 Oct 2, 2016 $ Fiscal Year Ended Net revenues: Company-operated stores Licensed stores Other Total net revenues Cost of sales including occupancy costs Store operating expenses Other operating expenses Depreciation and amortization expenses General and administrative expenses Restructuring and impairments Total operating expenses Income from equity investees Operating income Gain resulting from acquisition of joint venture Net gain resulting from divestiture of certain operations Interest income and other, net Interest expense Earnings before income taxes Income tax expense Net earnings including noncontrolling interests Net earnings/(loss) attributable to noncontrolling interests Net earnings attributable to Starbucks Earnings per share - basic Earnings per share diluted Weighted average shares outstanding: Basic Diluted 16,844.1 2,154.2 2,317.6 21,315.9 8,509.0 6,064.3 499.2 980.8 1,408.9 19,690.3 $ 2,652.2 2,377.0 24,719.5 10,174.5 7,193.2 539.3 1,247.0 1,759.0 224.4 21,137.4 301.2 3,883.3 1,376.4 499.2 191.4 (170.3) 5,780.0 1,262.0 4,518.0 (0.3) 4,518.3 3.27 $ 3.24 $ 17,650.7 $ 2,355.0 2,381.1 22,386.8 9,034.3 6,493.3 500.3 1,011.4 1,450.7 153.5 18,643.5 391.4 4,134.7 17,462.2 318.2 4,171.9 93.5 181.8 (92.5) 4,317.5 1,432.6 2,884.9 0.2 2,884.7 $ 1.99 $ 1.97 S 5.4 102.6 (81.3) 4,198.6 1,379.7 2,818.9 1.2 2,817.7 1.91 1.90 $ $ $ 1,382.7 1,394.6 1,449.5 1,461.5 1,471.6 1,486.7
Step by Step Solution
There are 3 Steps involved in it

Get step-by-step solutions from verified subject matter experts