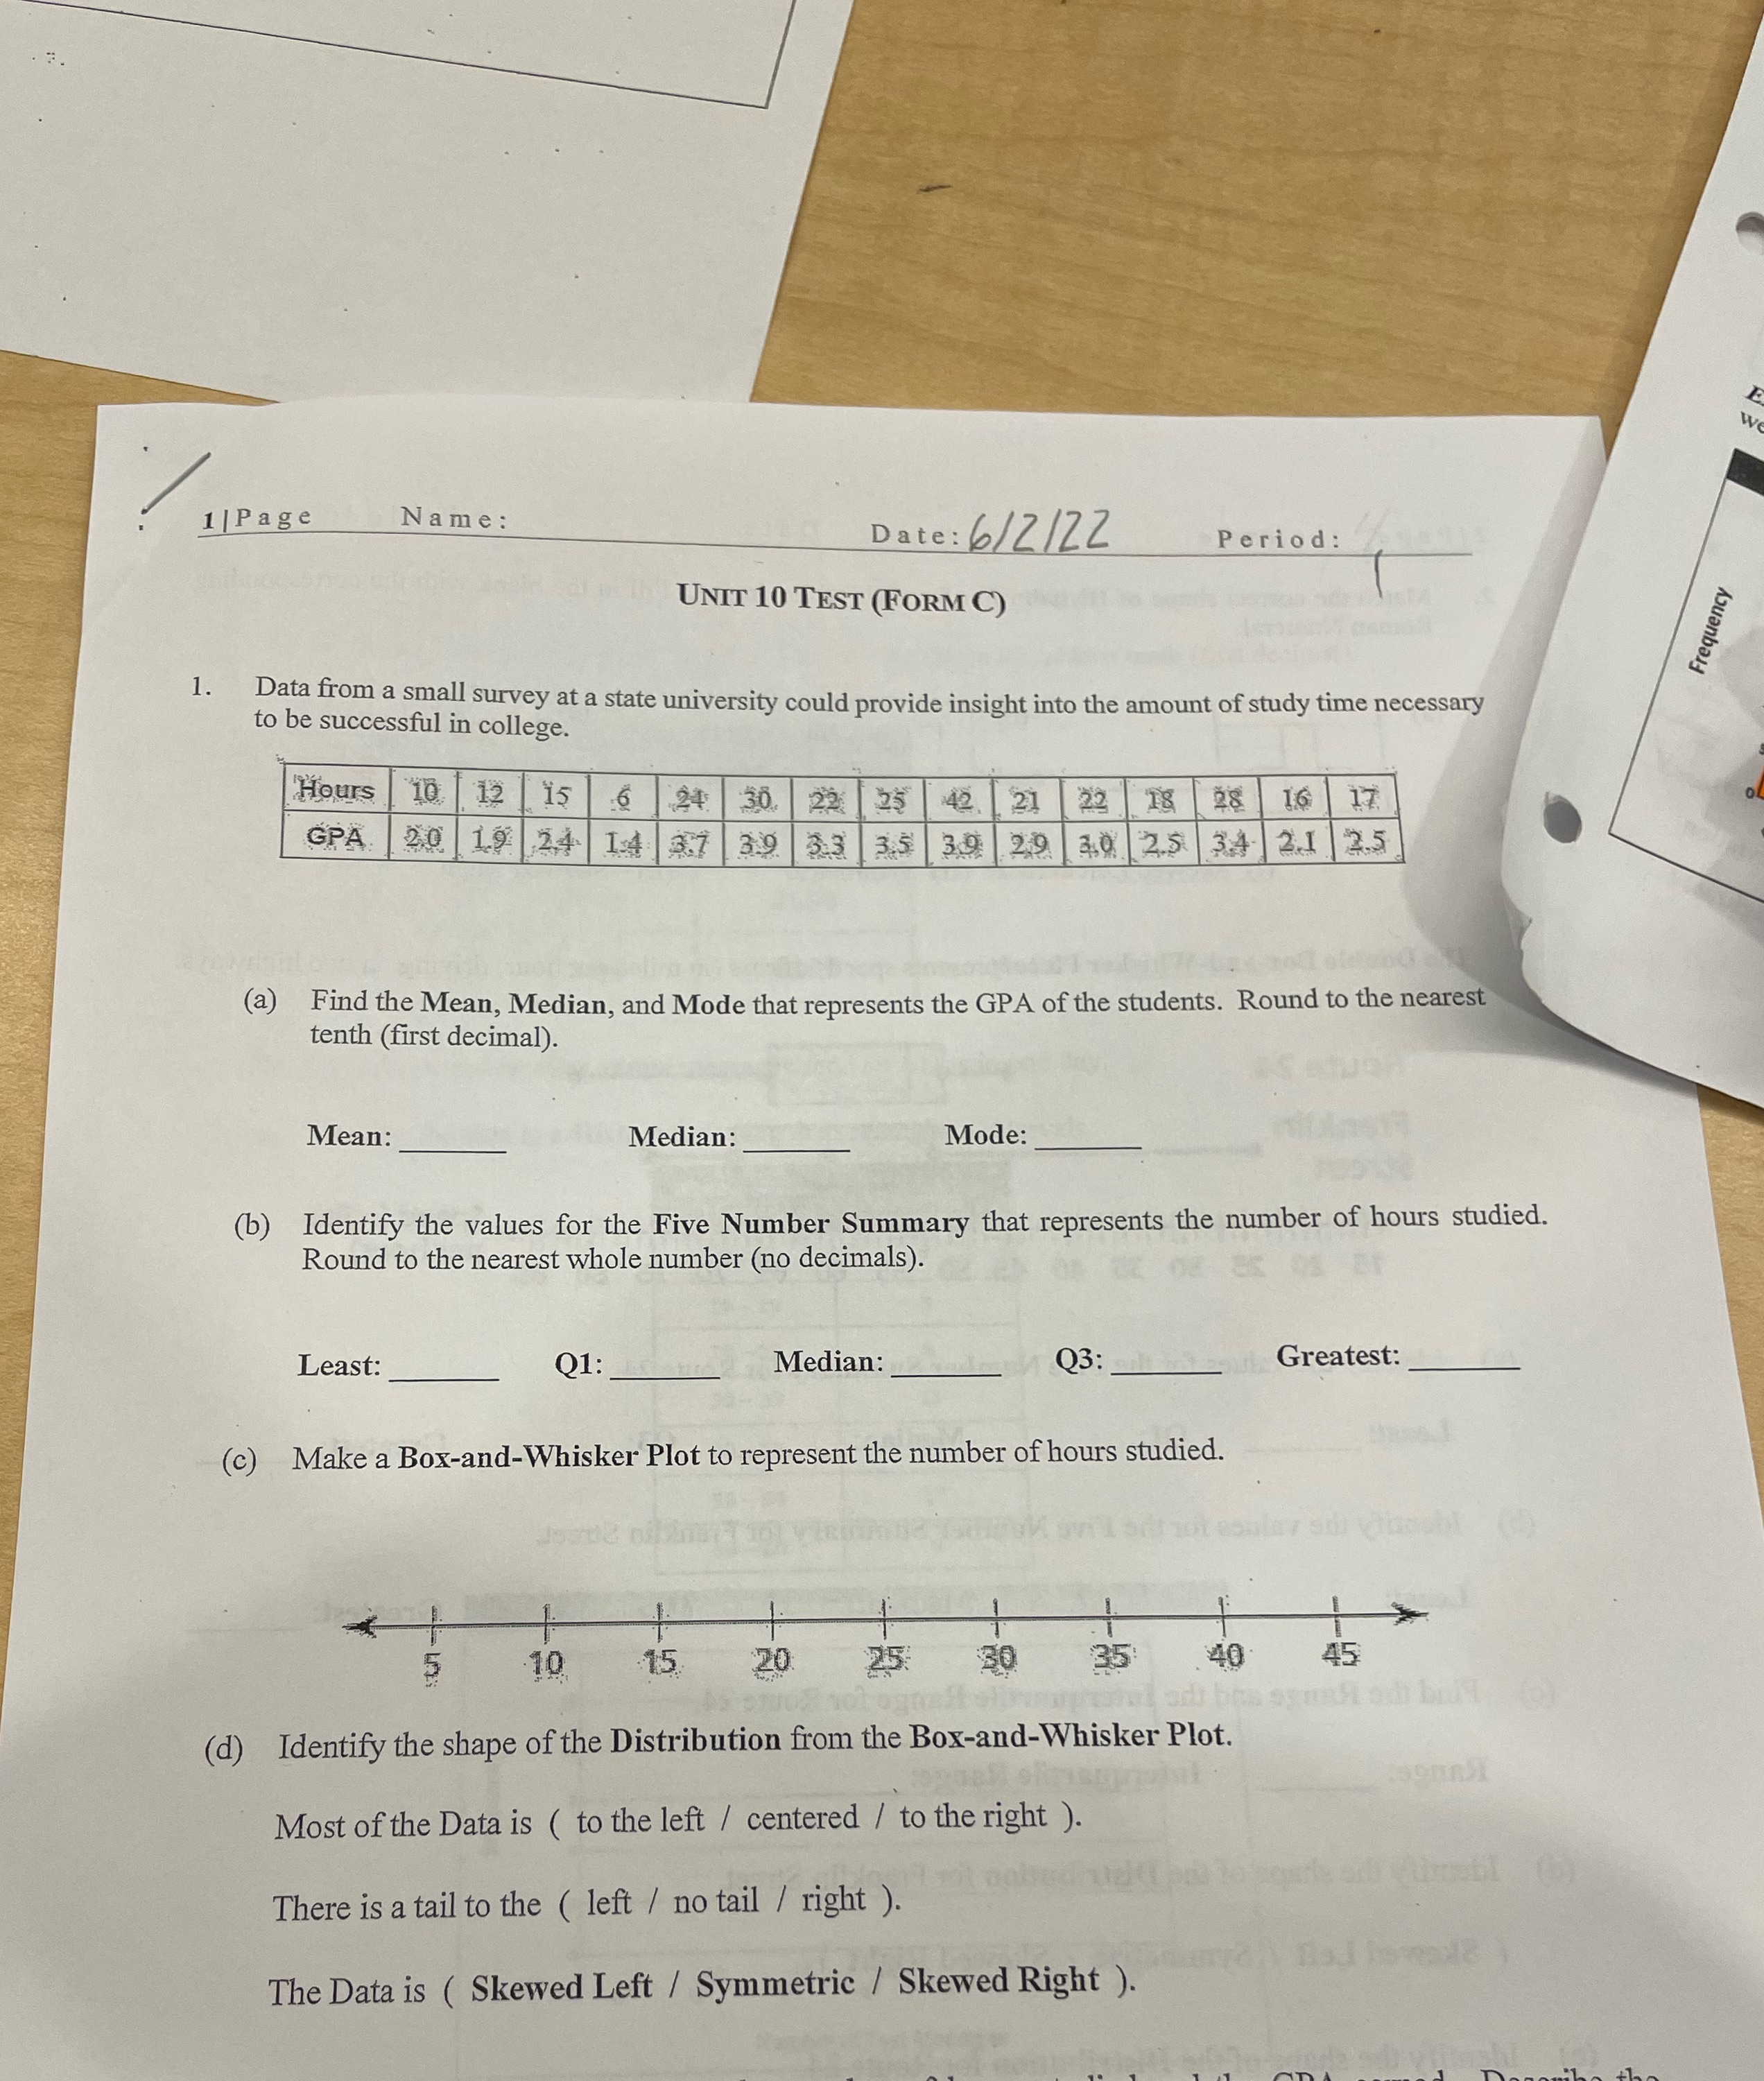
Question: Show the work please 1 |Page Name : Date : 6/2/ZZ Period : UNIT 10 TEST (FORM C) Frequency 1. Data from a small survey

Show the work please

Show the work please 1 |Page Name : Date : 6/2/ZZ
1 |Page Name : Date : 6/2/ZZ Period : UNIT 10 TEST (FORM C) Frequency 1. Data from a small survey at a state university could provide insight into the amount of study time necessary to be successful in college. "Hours 10 12 15 6 24 30 22 25 142 21 22 18 28 16 17 SPA 2.0 19 2.4 3.7 3.9 3:3 35 39 29 20 25 34 2.1 2.5 (a) Find the Mean, Median, and Mode that represents the GPA of the students. Round to the nearest tenth (first decimal). Mean: Median: Mode: ( b ) Identify the values for the Five Number Summary that represents the number of hours studied. Round to the nearest whole number (no decimals). Least: Q1: Median: Q3: Greatest: (c) Make a Box-and-Whisker Plot to represent the number of hours studied. 10 15 20 25: 30 35 40 45 (d) Identify the shape of the Distribution from the Box-and-Whisker Plot. Most of the Data is ( to the left / centered / to the right ). There is a tail to the ( left / no tail / right ). The Data is ( Skewed Left / Symmetric / Skewed Right )

Step by Step Solution

There are 3 Steps involved in it

1 Expert Approved Answer
Step: 1 Unlock blur-text-image
Question Has Been Solved by an Expert!

Get step-by-step solutions from verified subject matter experts

Step: 2 Unlock
Step: 3 Unlock

Students Have Also Explored These Related Mathematics Questions!