

Question: Show the work please :) EXHIBIT 1 | Projects' Free Cash Flows (dollars in thousands) Project number: 1 2 3 4 5 6 Initial Investment
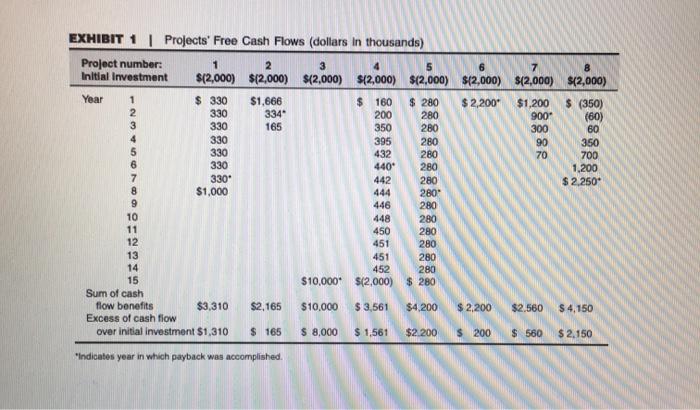

EXHIBIT 1 | Projects' Free Cash Flows (dollars in thousands) Project number: 1 2 3 4 5 6 Initial Investment $(2,000) $(2,000) $12,000) $(2,000) $(2,000) $12,000) Year 1 $ 330 $1,666 $ 160 $ 280 $ 2,200" 2 330 334 200 280 3 330 165 350 280 4 330 395 280 5 330 432 280 6 330 440* 280 7 330" 442 280 8 $1,000 444 280 9 446 280 10 448 280 11 450 280 12 451 280 13 451 280 14 452 280 15 $10,000+ $(2.000) $ 280 Sum of cash flow benefits $3,310 $2,165 $10.000 $3,561 $4,200 $ 2,200 Excess of cash flow over initial investment $1,310 $ 165 $ 8,000 $ 1.561 $2.200 $ 200 7 $(2,000) $12,000) $1,200 $ (350) 900* (60) 300 60 90 350 70 700 1,200 $ 2.250* $2.560 $ 4,150 $ 560 $ 2.150 indicatos year in which payback was accomplished. To stimulate your analysis, consider the following questions: 1. Can you rank the projects simply by inspecting the cash flows? 2. What criteria might you use to rank the projects? Which quantitative ranking methods are better? Why? 3. What is the ranking you found by using quantitative methods? Does this ranking differ from the ranking obtained by simple inspection of the cash flows? 4. What kinds of real investment projects have cash flows similar to those in Exhibit 1
Step by Step Solution
There are 3 Steps involved in it

Get step-by-step solutions from verified subject matter experts