

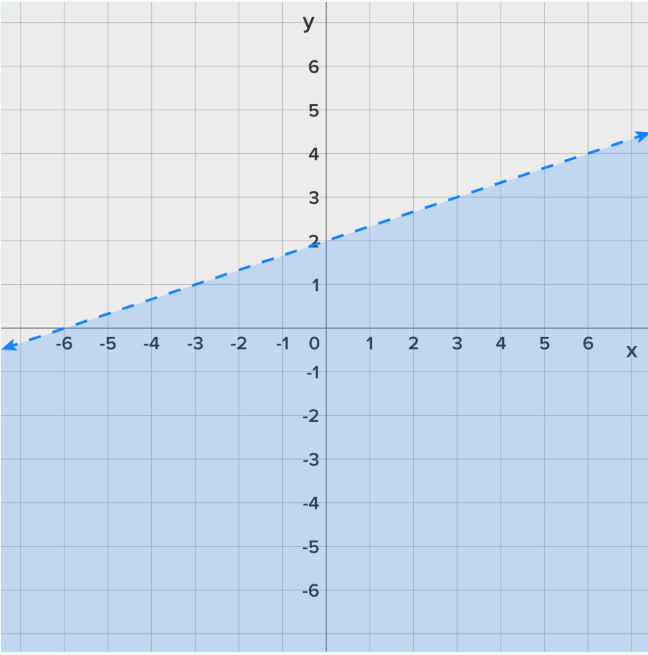
Question: Show what graph is the correct graph: Select the graph of the linear inequality y greater than 1 third x plus 2 . 5 4
Show what graph is the correct graph: Select the graph of the linear inequality y greater than 1 third x plus 2 .
 5 4 3 2 -6 -5 -4 -3 -2 -1 0 1 2 3 4 5 6 X -1 -2 -3 -4 -5 -6
Step by Step Solution
There are 3 Steps involved in it
1 Expert Approved Answer
Step: 1 Unlock

Question Has Been Solved by an Expert!
Get step-by-step solutions from verified subject matter experts
Step: 2 Unlock
Step: 3 Unlock