

Question: Show work and steps 10. (10 pts) The following data represent the number of cigarettes (in billions) exported from the United States by year. (a)
Show work and steps
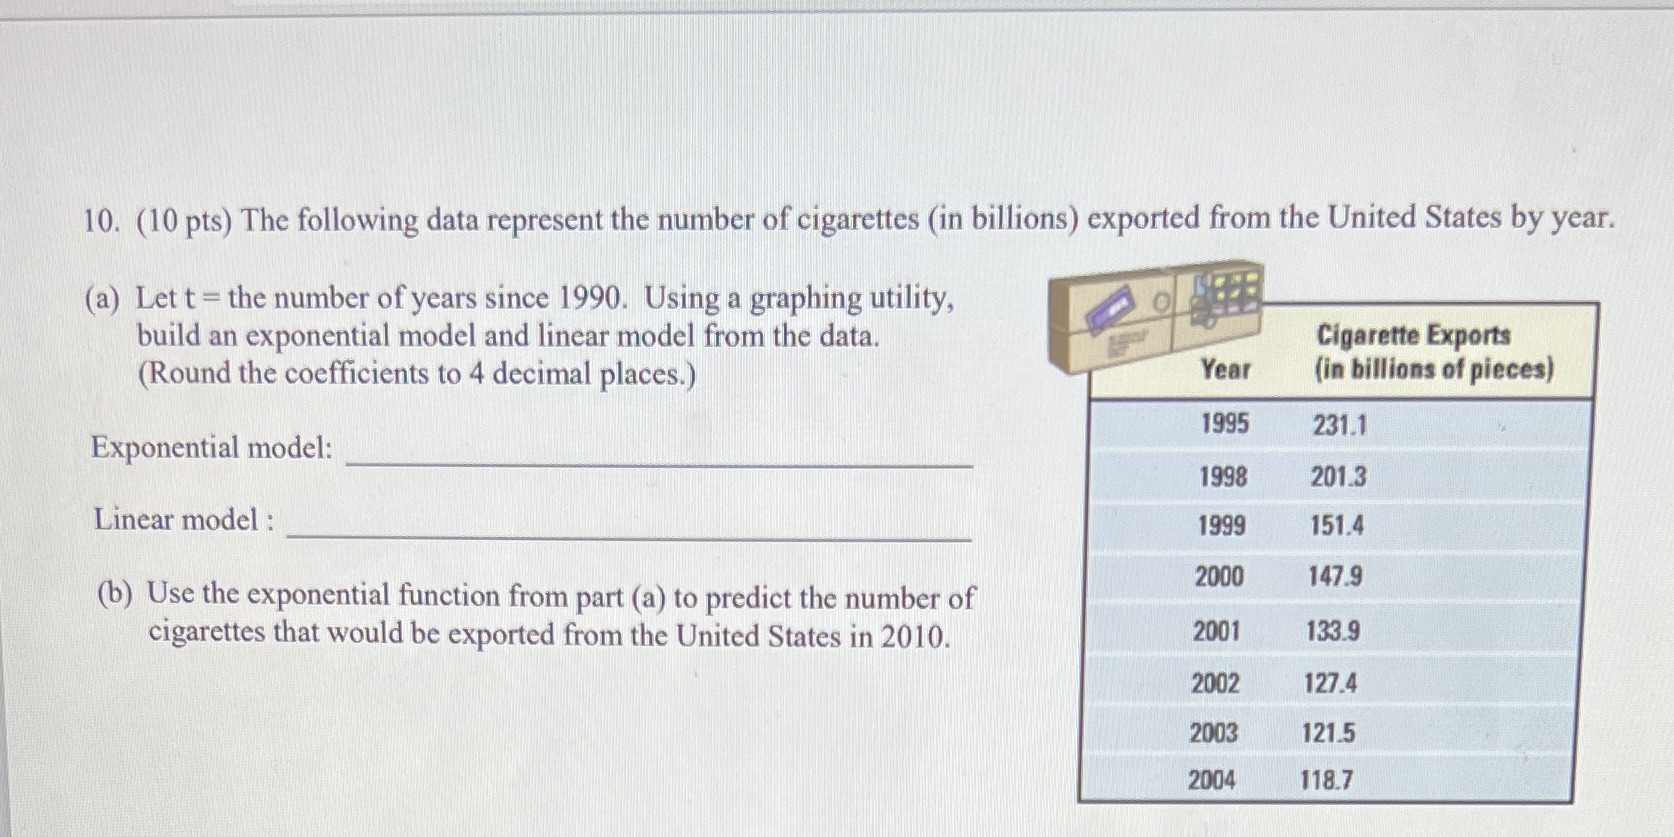
10. (10 pts) The following data represent the number of cigarettes (in billions) exported from the United States by year. (a) Let t = the number of years since 1990. Using a graphing utility, o build an exponential model and linear model from the data. Cigarette Exports (Round the coefficients to 4 decimal places.) Year (in billions of pieces) 1995 231.1 Exponential model: 1998 201.3 Linear model : 1999 151.4 2000 147.9 (b) Use the exponential function from part (a) to predict the number of cigarettes that would be exported from the United States in 2010. 2001 133.9 2002 127.4 2003 121.5 2004 118.7
Step by Step Solution
There are 3 Steps involved in it
1 Expert Approved Answer
Step: 1 Unlock

Question Has Been Solved by an Expert!
Get step-by-step solutions from verified subject matter experts
Step: 2 Unlock
Step: 3 Unlock