

Question: Show work done on microsoft excel. . Read the given information carefully and use the forecast given below to answer the following questions. 1- Propose
Show work done on microsoft excel.
. Read the given information carefully and use the forecast given below to answer the following questions. 1- Propose a level plan for the next 12 months, October 2017-September 2018. 2 Propose a chase plan for the next 12 months, October 2017-September 2018.
Discuss the main characteristics of these two plans in contrast with each other. Between these two plans, which plan would you recommend the company to choose? Justify your recommendation. The forecast for t=46-57 (Oct 2017-Sept 2018) is given below. Forecasts for t=58 (Oct 2018) are also given just in case you need it.

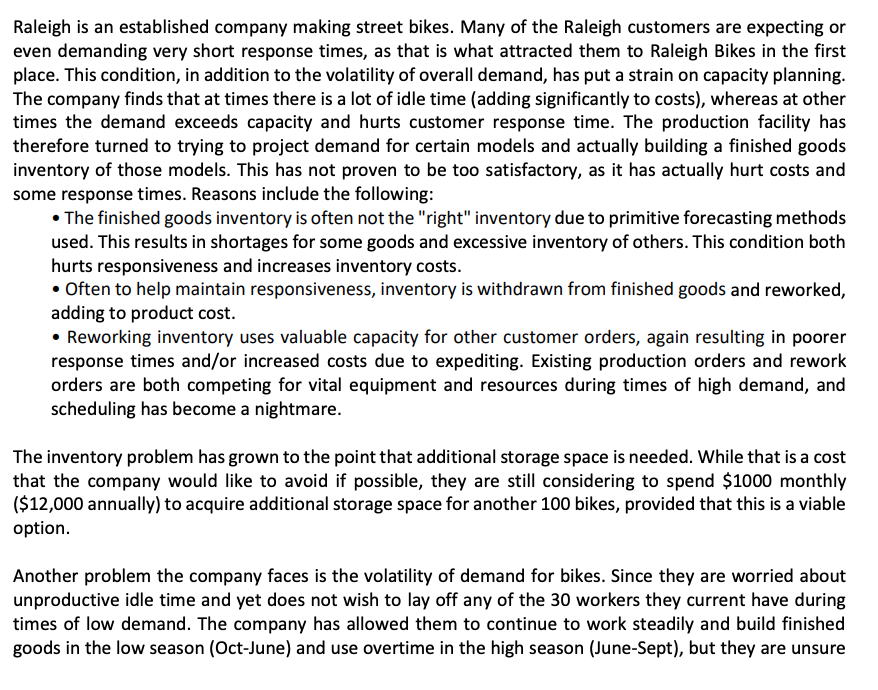
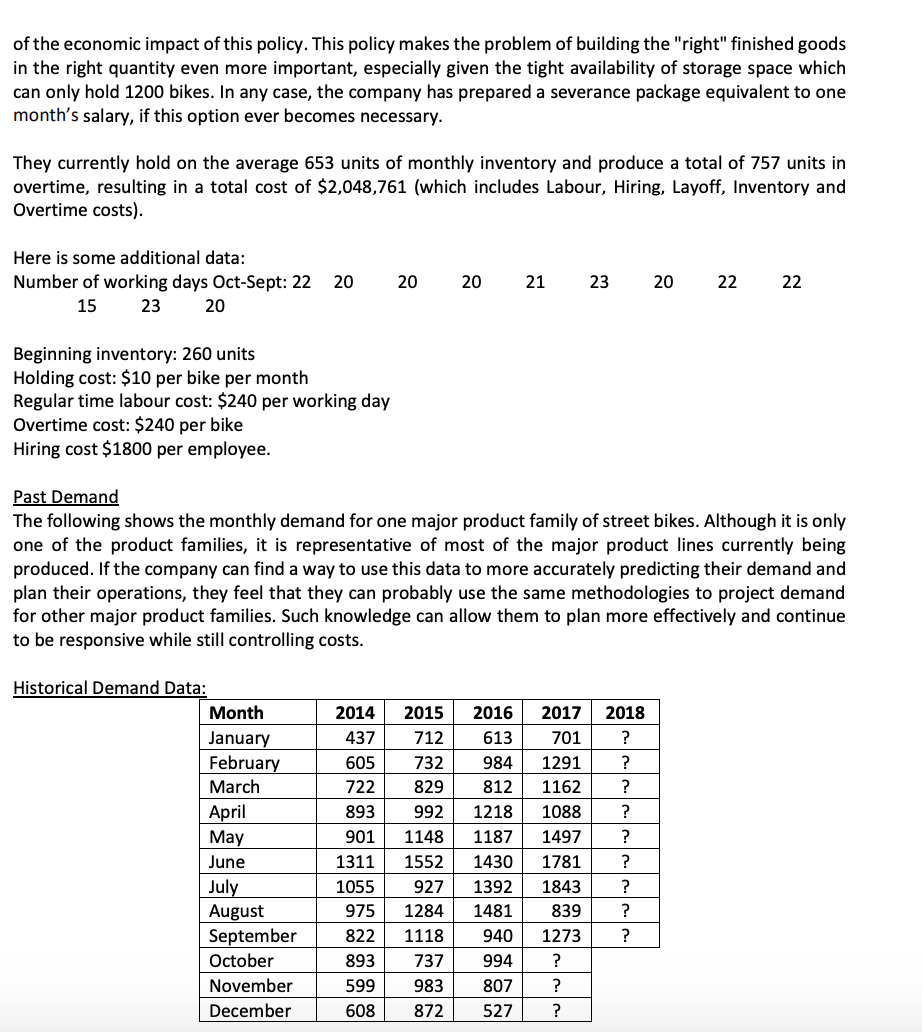
T=46 T=47 T=48 T=49 T=50 T=51 T=52 T=53 T=54 T=55 T=56 T=57 T=58 1068 984 896 808 1077 1085 1355 1440 1884 1491 1507 1238 1120 Raleigh is an established company making street bikes. Many of the Raleigh customers are expecting or even demanding very short response times, as that is what attracted them to Raleigh Bikes in the first place. This condition, in addition to the volatility of overall demand, has put a strain on capacity planning. The company finds that at times there is a lot of idle time (adding significantly to costs), whereas at other times the demand exceeds capacity and hurts customer response time. The production facility has therefore turned to trying to project demand for certain models and actually building a finished goods inventory of those models. This has not proven to be too satisfactory, as it has actually hurt costs and some response times. Reasons include the following: The finished goods inventory is often not the "right" inventory due to primitive forecasting methods used. This results in shortages for some goods and excessive inventory of others. This condition both hurts responsiveness and increases inventory costs. Often to help maintain responsiveness, inventory is withdrawn from finished goods and reworked, adding to product cost. Reworking inventory uses valuable capacity for other customer orders, again resulting in poorer response times and/or increased costs due to expediting. Existing production orders and rework orders are both competing for vital equipment and resources during times of high demand, and scheduling has become a nightmare. The inventory problem has grown to the point that additional storage space is needed. While that is a cost that the company would like to avoid if possible, they are still considering to spend $1000 monthly ($12,000 annually) to acquire additional storage space for another 100 bikes, provided that this is a viable option. Another problem the company faces is the volatility of demand for bikes. Since they are worried about unproductive idle time and yet does not wish to lay off any of the 30 workers they current have during times of low demand. The company has allowed them to continue to work steadily and build finished goods in the low season (Oct-June) and use overtime in the high season (June-Sept), but they are unsure of the economic impact of this policy. This policy makes the problem of building the "right" finished goods in the right quantity even more important, especially given the tight availability of storage space which can only hold 1200 bikes. In any case, the company has prepared a severance package equivalent to one month's salary, if this option ever becomes necessary. They currently hold on the average 653 units of monthly inventory and produce a total of 757 units in overtime, resulting in a total cost of $2,048,761 (which includes Labour, Hiring, Layoff, Inventory and Overtime costs). Here is some additional data: Number of working days Oct-Sept: 22 15 23 20 20 20 20 21 23 20 22 22 Beginning inventory: 260 units Holding cost: $10 per bike per month Regular time labour cost: $240 per working day Overtime cost: $240 per bike Hiring cost $1800 per employee. Past Demand The following shows the monthly demand for one major product family of street bikes. Although it is only one of the product families, it is representative of most of the major product lines currently being produced. If the company can find a way to use this data to more accurately predicting their demand and plan their operations, they feel that they can probably use the same methodologies to project demand for other major product families. Such knowledge can allow them to plan more effectively and continue to be responsive while still controlling costs. 2018 ? ? ? Historical Demand Data: Month January February March April May June July August September October November December 2014 437 605 722 893 901 1311 1055 975 822 893 599 608 2015 712 732 829 992 1148 1552 927 1284 1118 737 983 872 2016 613 984 812 1218 1187 1430 1392 1481 940 994 807 527 2017 701 1291 1162 1088 1497 1781 1843 839 1273 ? ? ? III ? ? ? ? ? ? T=46 T=47 T=48 T=49 T=50 T=51 T=52 T=53 T=54 T=55 T=56 T=57 T=58 1068 984 896 808 1077 1085 1355 1440 1884 1491 1507 1238 1120 Raleigh is an established company making street bikes. Many of the Raleigh customers are expecting or even demanding very short response times, as that is what attracted them to Raleigh Bikes in the first place. This condition, in addition to the volatility of overall demand, has put a strain on capacity planning. The company finds that at times there is a lot of idle time (adding significantly to costs), whereas at other times the demand exceeds capacity and hurts customer response time. The production facility has therefore turned to trying to project demand for certain models and actually building a finished goods inventory of those models. This has not proven to be too satisfactory, as it has actually hurt costs and some response times. Reasons include the following: The finished goods inventory is often not the "right" inventory due to primitive forecasting methods used. This results in shortages for some goods and excessive inventory of others. This condition both hurts responsiveness and increases inventory costs. Often to help maintain responsiveness, inventory is withdrawn from finished goods and reworked, adding to product cost. Reworking inventory uses valuable capacity for other customer orders, again resulting in poorer response times and/or increased costs due to expediting. Existing production orders and rework orders are both competing for vital equipment and resources during times of high demand, and scheduling has become a nightmare. The inventory problem has grown to the point that additional storage space is needed. While that is a cost that the company would like to avoid if possible, they are still considering to spend $1000 monthly ($12,000 annually) to acquire additional storage space for another 100 bikes, provided that this is a viable option. Another problem the company faces is the volatility of demand for bikes. Since they are worried about unproductive idle time and yet does not wish to lay off any of the 30 workers they current have during times of low demand. The company has allowed them to continue to work steadily and build finished goods in the low season (Oct-June) and use overtime in the high season (June-Sept), but they are unsure of the economic impact of this policy. This policy makes the problem of building the "right" finished goods in the right quantity even more important, especially given the tight availability of storage space which can only hold 1200 bikes. In any case, the company has prepared a severance package equivalent to one month's salary, if this option ever becomes necessary. They currently hold on the average 653 units of monthly inventory and produce a total of 757 units in overtime, resulting in a total cost of $2,048,761 (which includes Labour, Hiring, Layoff, Inventory and Overtime costs). Here is some additional data: Number of working days Oct-Sept: 22 15 23 20 20 20 20 21 23 20 22 22 Beginning inventory: 260 units Holding cost: $10 per bike per month Regular time labour cost: $240 per working day Overtime cost: $240 per bike Hiring cost $1800 per employee. Past Demand The following shows the monthly demand for one major product family of street bikes. Although it is only one of the product families, it is representative of most of the major product lines currently being produced. If the company can find a way to use this data to more accurately predicting their demand and plan their operations, they feel that they can probably use the same methodologies to project demand for other major product families. Such knowledge can allow them to plan more effectively and continue to be responsive while still controlling costs. 2018 ? ? ? Historical Demand Data: Month January February March April May June July August September October November December 2014 437 605 722 893 901 1311 1055 975 822 893 599 608 2015 712 732 829 992 1148 1552 927 1284 1118 737 983 872 2016 613 984 812 1218 1187 1430 1392 1481 940 994 807 527 2017 701 1291 1162 1088 1497 1781 1843 839 1273
Step by Step Solution
There are 3 Steps involved in it

Get step-by-step solutions from verified subject matter experts